Special Reports
Domain-specific analytical reports for management decisions.
Overview
Special Reports is a curated set of management-grade reports that owners and category managers ask for repeatedly. Each report supports date-range and dimension filters (item / category / customer / location / salesman) and exports to Excel; drill-through opens the underlying transactions.
Top Customers
Top N customers by revenue, margin or invoice count for any period. The standard slicer on the right lets you flip dimension; the comparison column shows the same period last year.
Top Items
Top N items by sales value, quantity or margin. Bottom-N is also a single click — useful for catalogue rationalisation.
Dead Stock
Items with no movement for N days, weighted by stock value. The candidate set for clearance pricing, return-to-supplier or write-off.
Item Rotation
Number of times each item turned over in the period (cost of goods sold ÷ average inventory). High rotation means efficient inventory; low rotation means stuck cash.
Customer Loyalty
Repeat-purchase analysis with visit counts, gap days and average ticket size. The basis for loyalty-programme tier assignment and for win-back campaigns.
Credit Risk
Customers approaching or exceeding their credit limit, with their current overdue and credit utilisation percent. Collection team starts every morning here.
Supplier Performance
On-time delivery percent, quality-reject percent, lead-time accuracy and price-trend per supplier. Feeds the Vendor Selection in MRP and the annual supplier review.
Gross Margin Trend
Margin percent over time, by category or by location. Trend lines make declining margins obvious months before the bottom line shows the impact.
Cash Flow Projection
Expected receipts and payments by week for the next 30 / 60 / 90 days, computed from ageing schedules and open POs. The standard input to the weekly cash-call meeting.
Discount Given
Discount value by customer, item, salesman or period. Useful for catching unauthorised discounts and for revisiting list prices that everyone is discounting from.
Returns Analysis
Return rate by item, customer and reason code. A spike on one item is usually a quality issue; a spike from one customer is usually a relationship issue.
Salesman Performance
Per-salesman revenue, margin, active customer count and conversion rate (quotes to invoices). The basis for incentive computation.
Expiry Loss
Stock written off due to expiry, by category and value, monthly. A persistent loss means safety stock is too high or rotation discipline is weak.
Stock Cover Days
How many days of forward demand the current stock covers (on-hand quantity ÷ average daily sales). Items with very high or very low cover are flagged for planner attention.
Reorder Suggestion
Items currently below their ROP needing immediate replenishment. Mid-week complement to the formal MRP run.
Audit Trail
Who changed what and when, across all transactions and masters. The first stop for any "where did this come from" question.
Application Log
System events and errors — useful for support to diagnose intermittent issues. Most operators never need this screen.
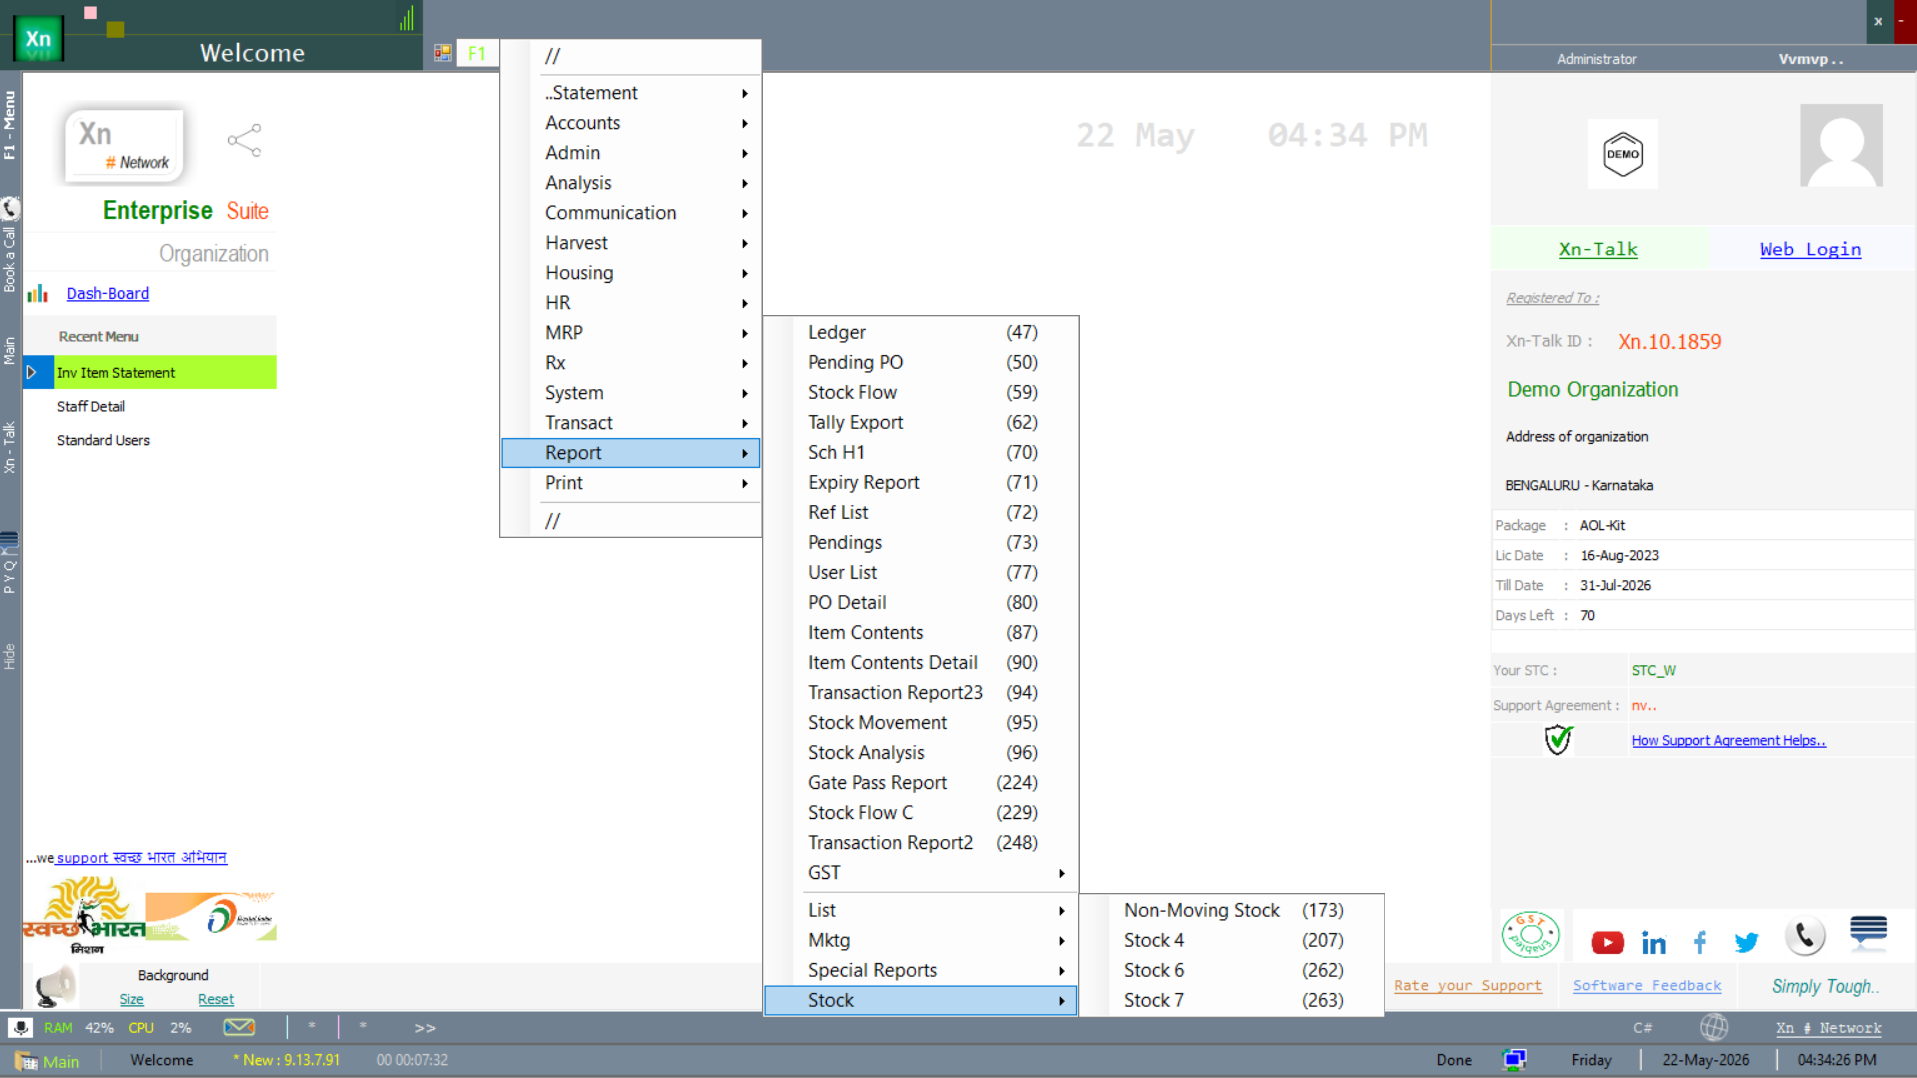
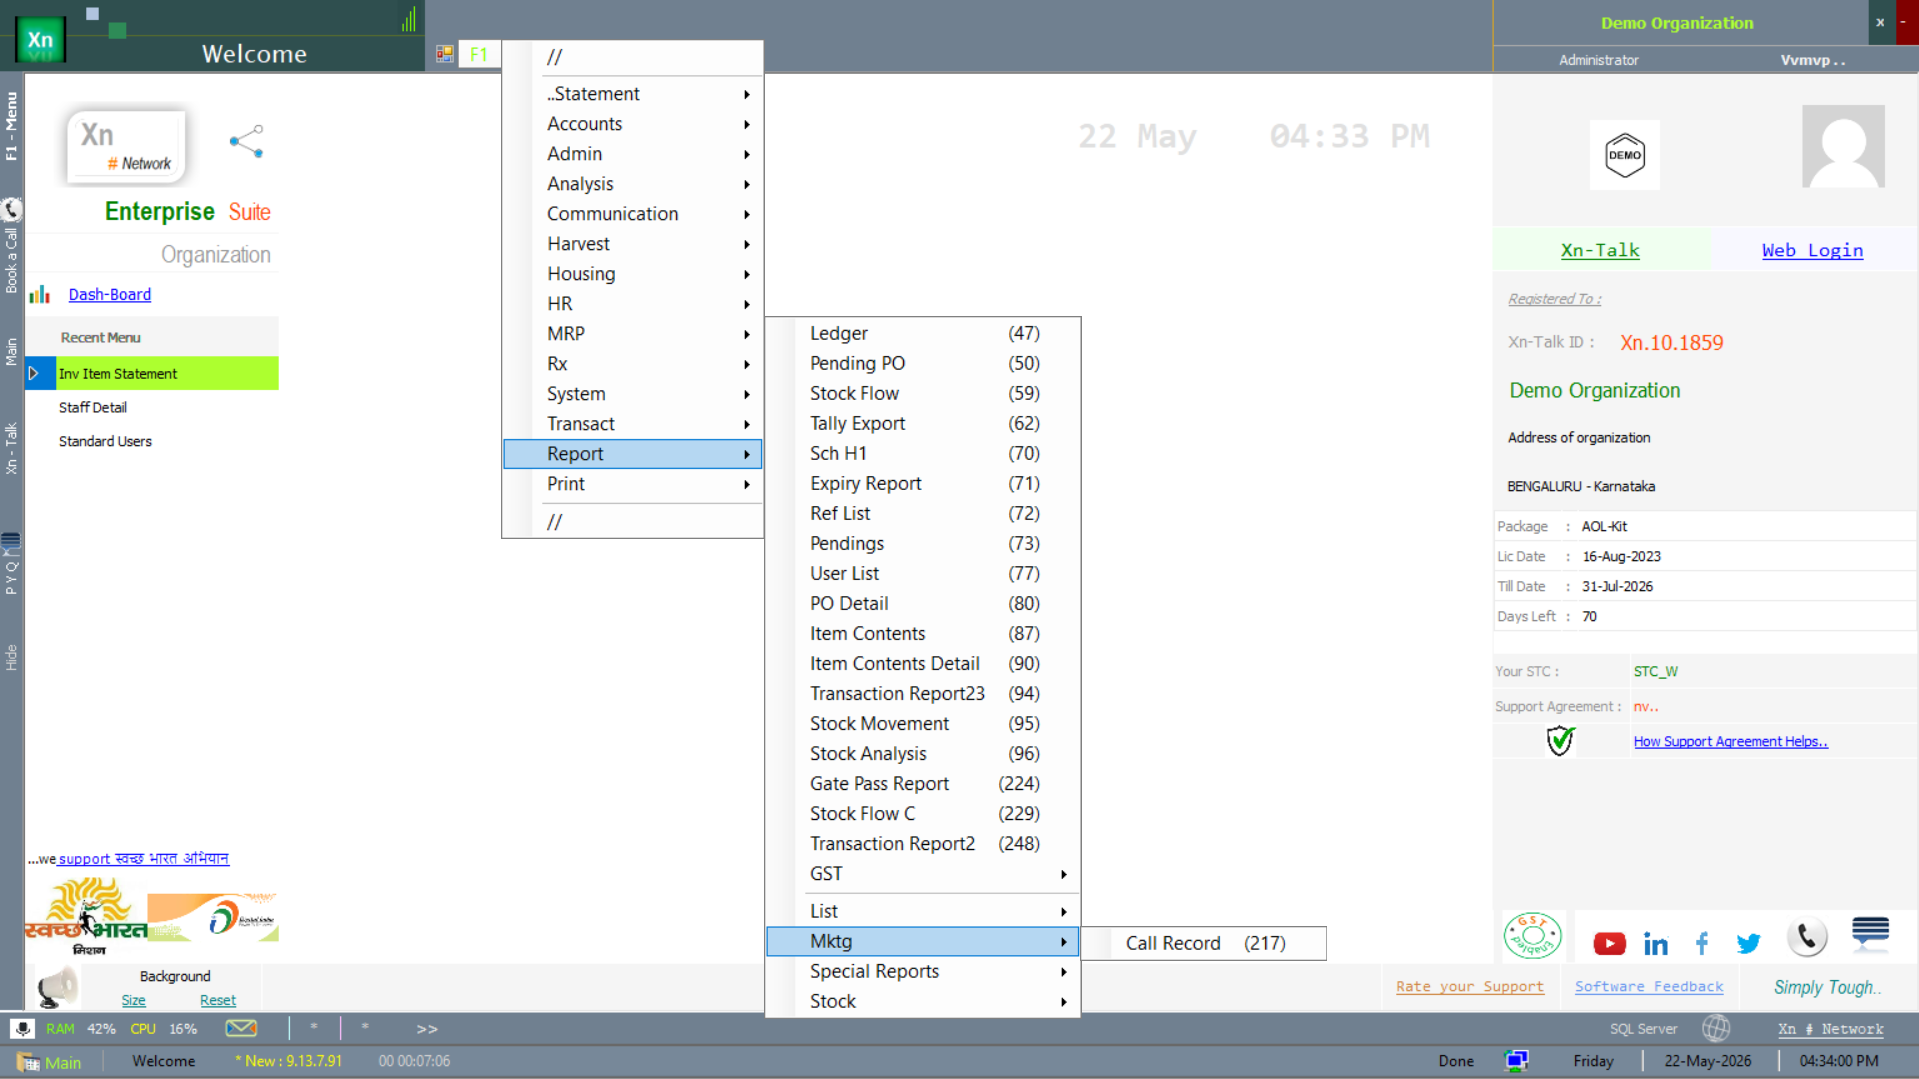
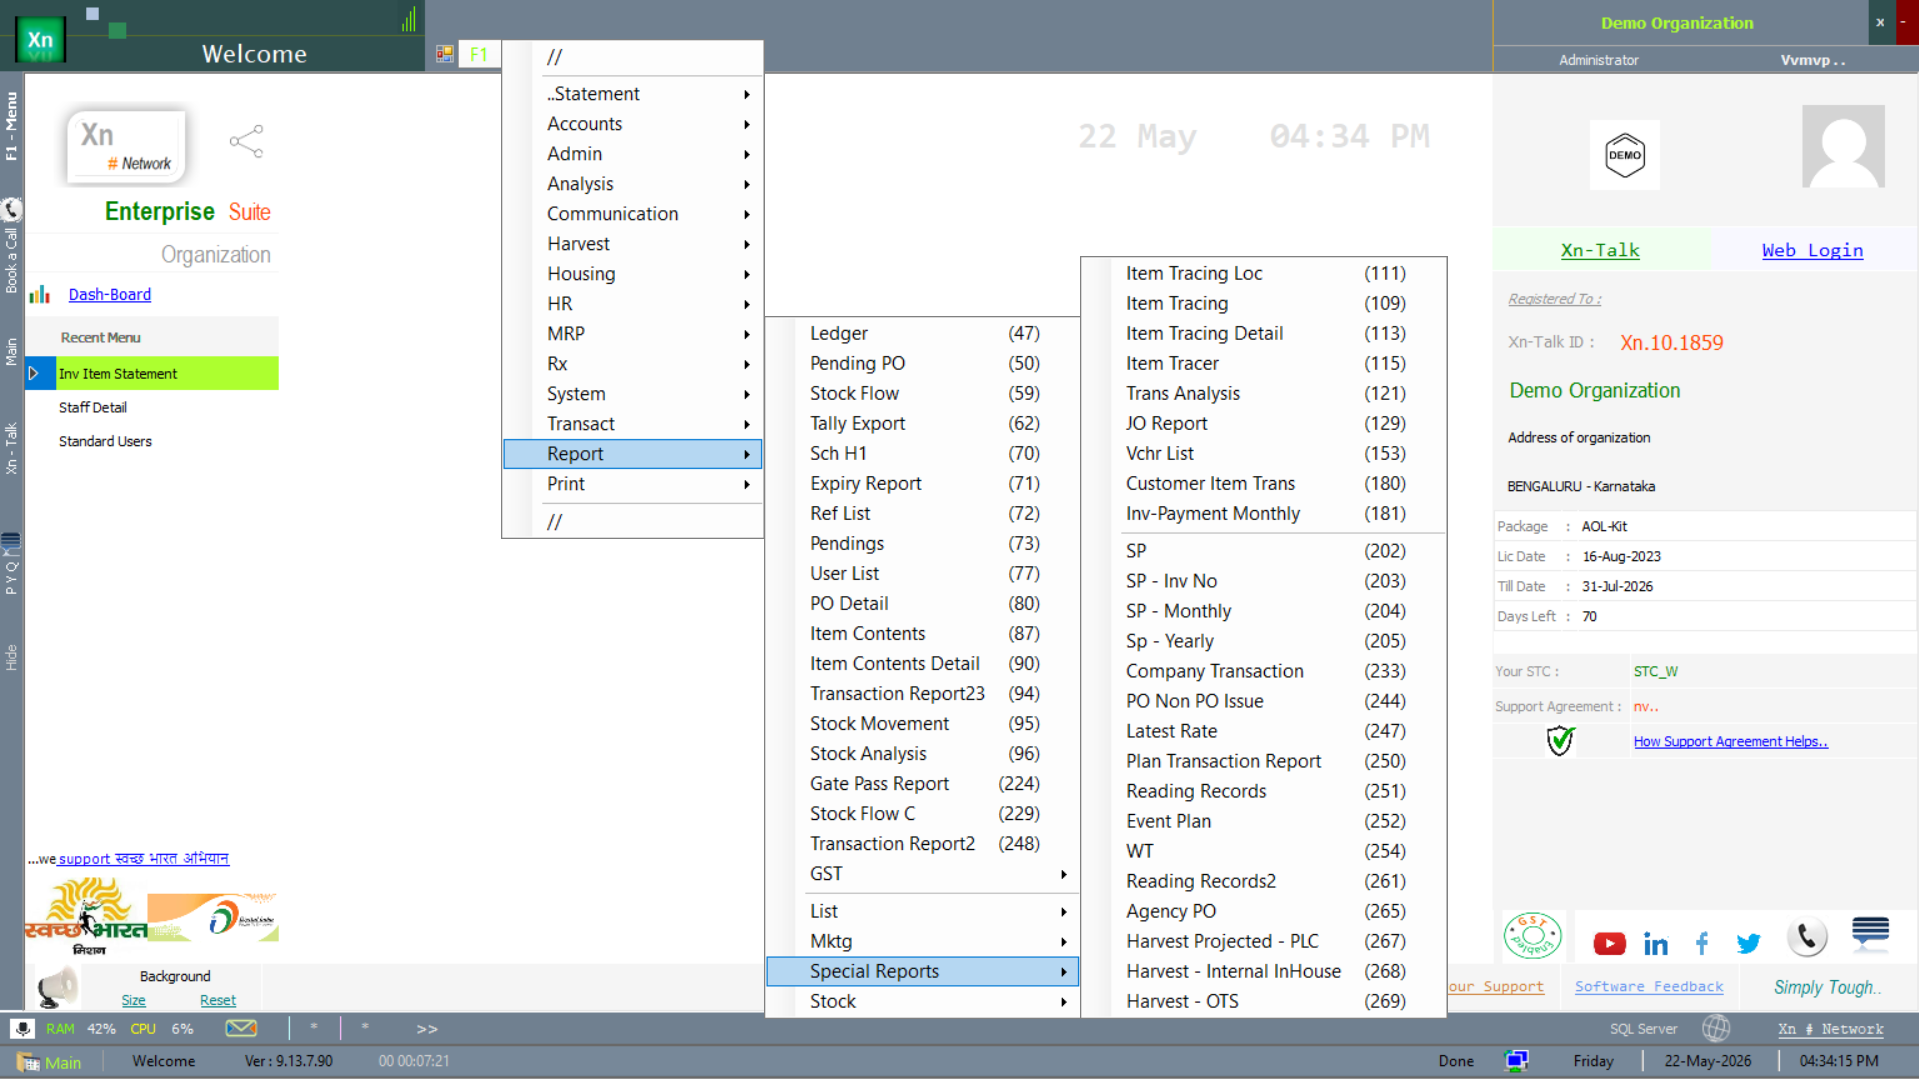
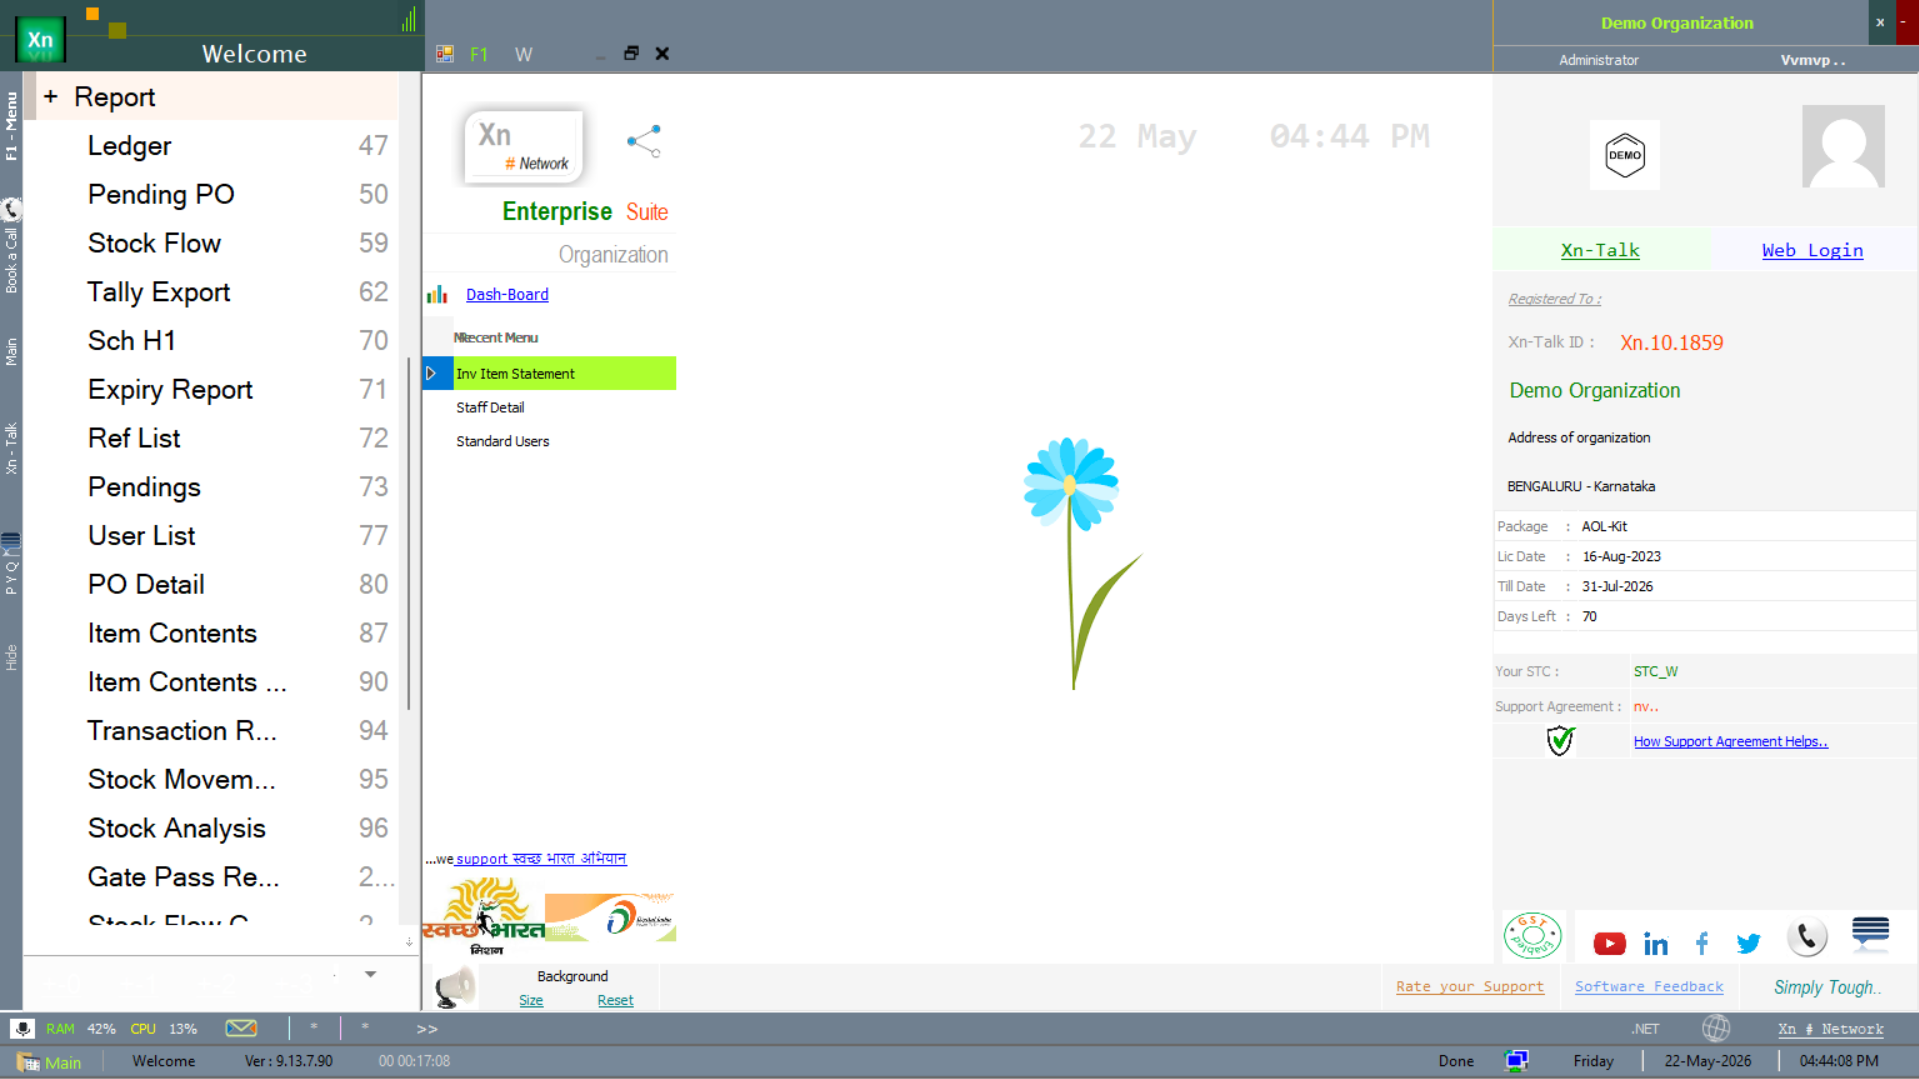
Special Reports menu
Special Reports live under the Report branch of the Welcome screen. The submenu surfaces 25+ analytical reports plus marketing and list sub-branches.
Procurement & PO-side reports
The reports below track the procurement cycle from requisition through PO to receipt — the buyer's daily workbench complement to the PO Tracker.
Pending PO Request
The Pending PO Req report lists requisitions awaiting PO conversion, by date range. The buyer's morning queue.

Requisition Price Status
The Req Price Status report tracks per-requisition price-discovery state — quotes received, quotes pending, lowest-quote selected — filtered by enterprise and date.

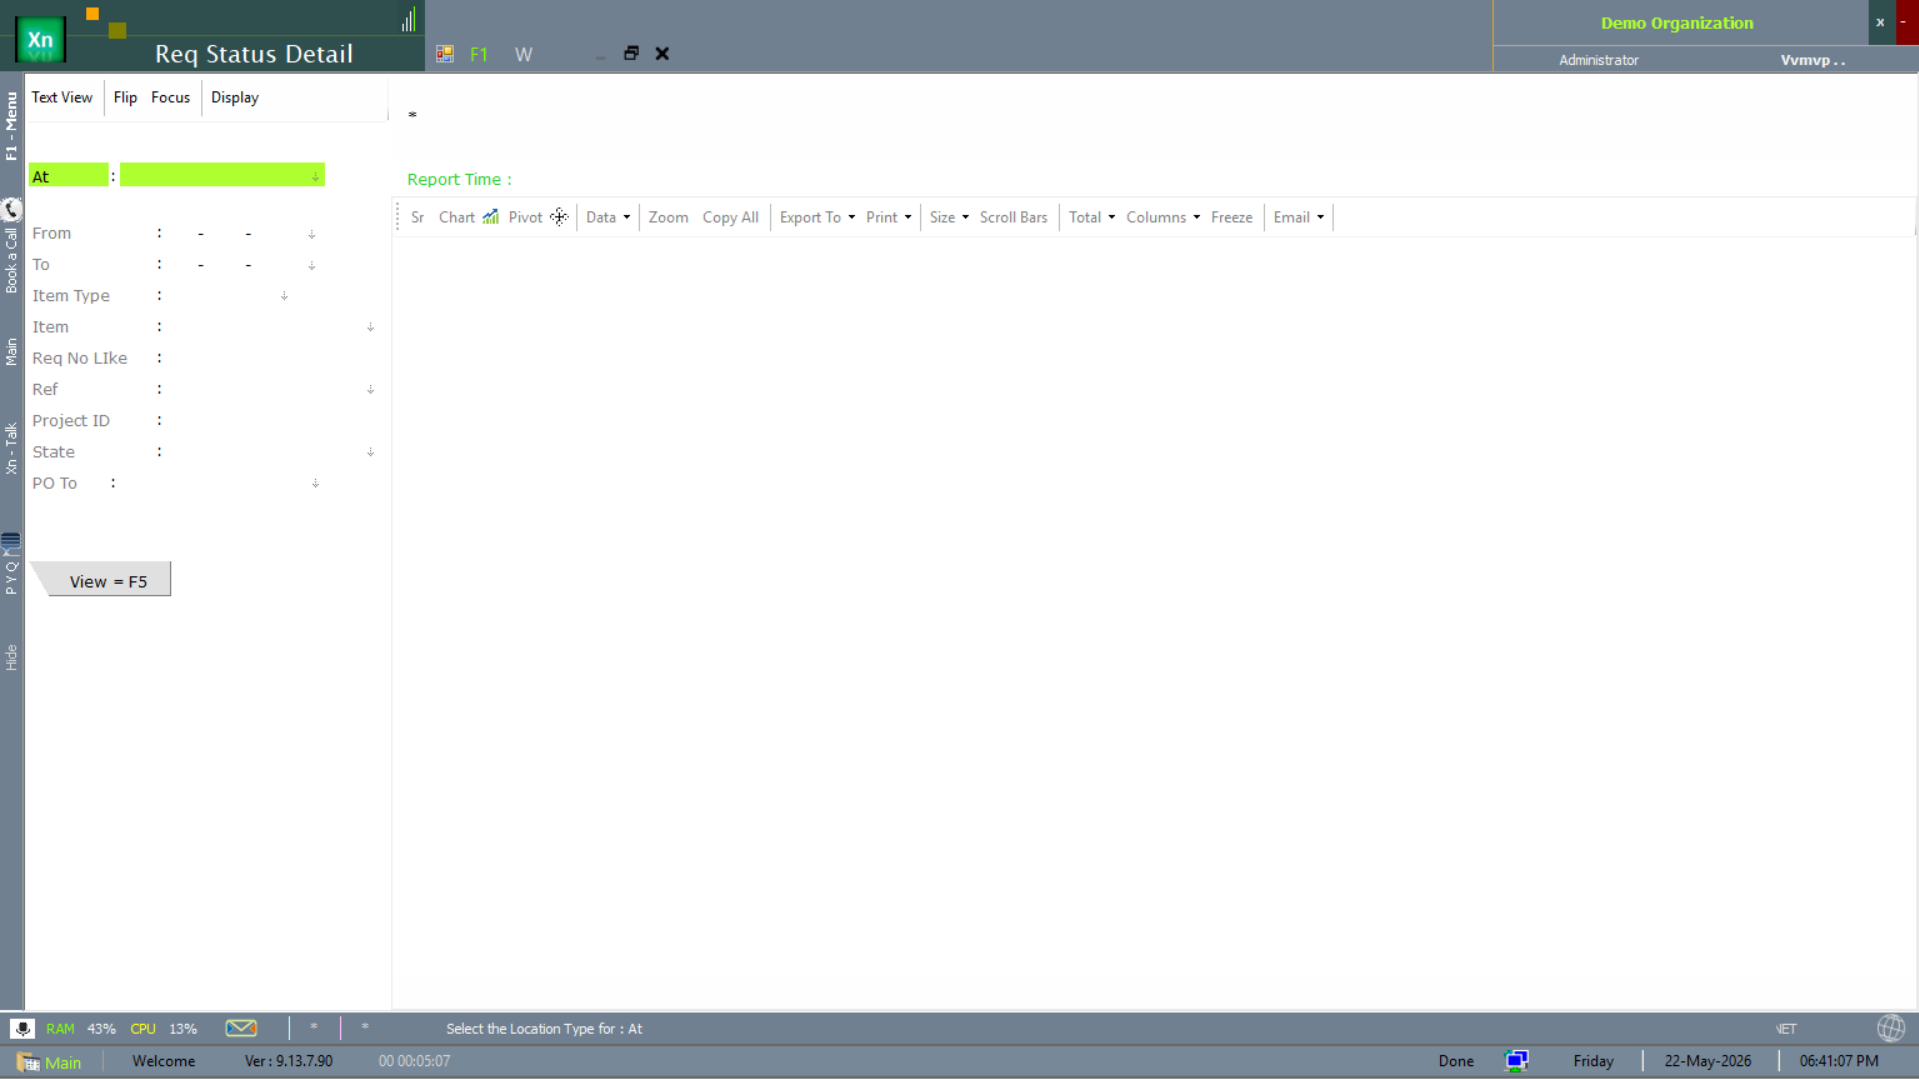
Requisition Status Detail
The Req Status Detail view is the multi-dimension drill on requisition status — useful when you need to slice by department, item, supplier and time together.
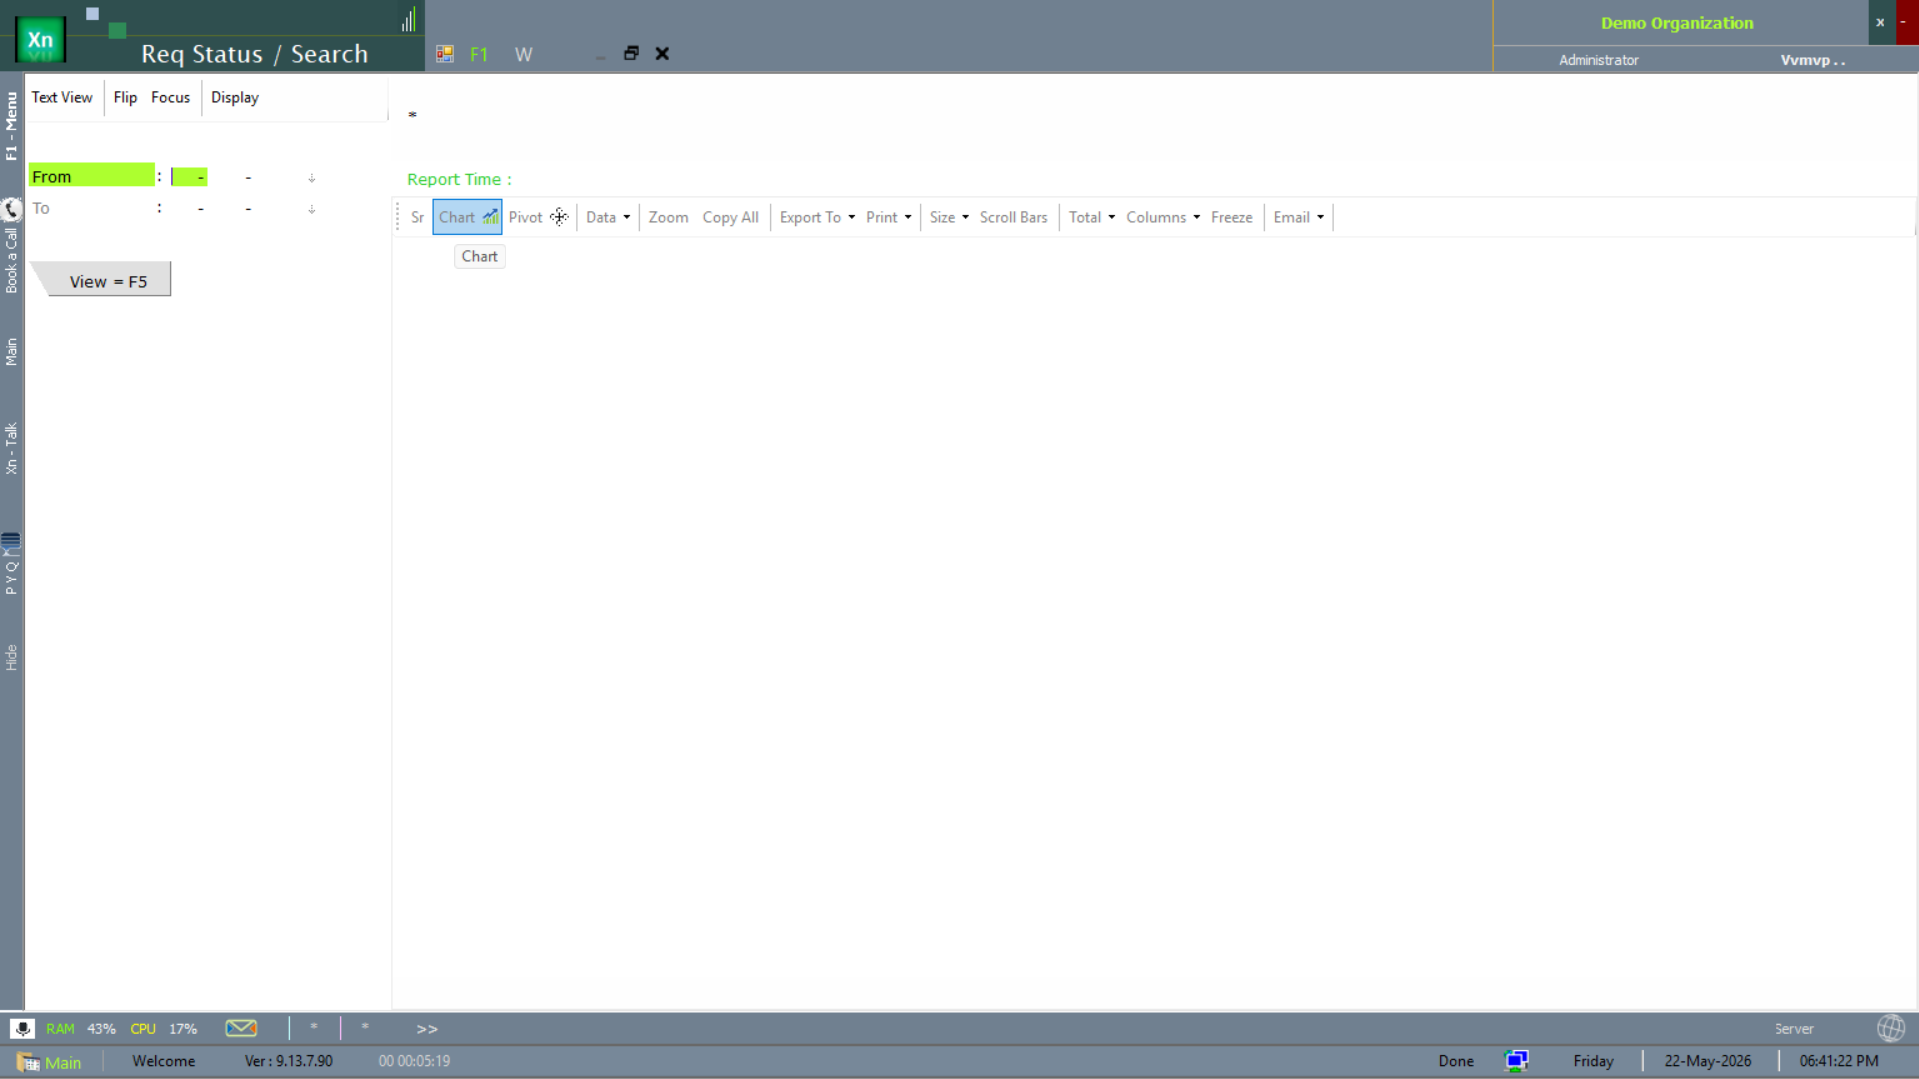
Requisition Status / Search
The Req Status / Search screen is the search-driven equivalent — supports the chart view alongside the table.
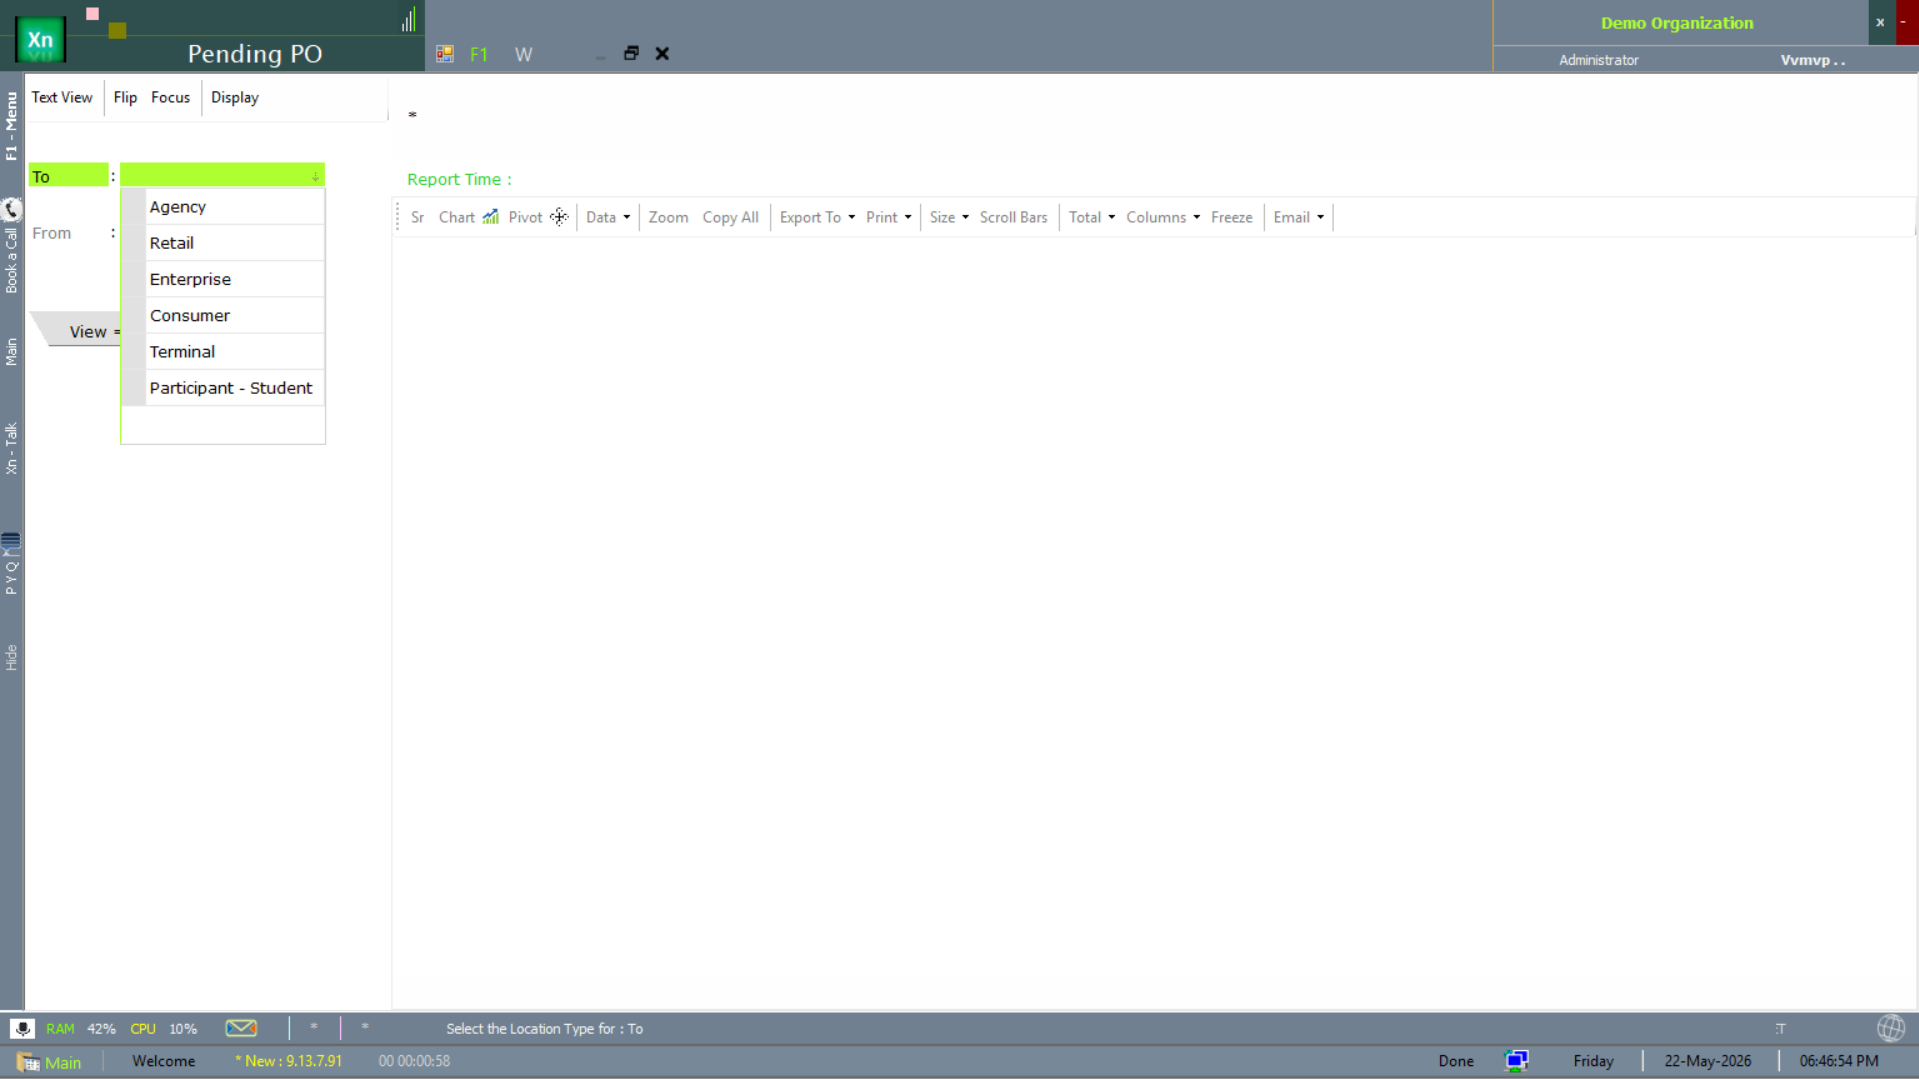
Pending PO
The Pending PO report is the open-PO list scoped by entity type (Enterprise / Retail / Agency / Terminal). The complement to the PO Tracker for the higher-level view.
PO / Non-PO Issue
The PO NonPO Issue report distinguishes issues against a PO from free-form non-PO issues — useful for compliance reviews where you need to spot purchases that bypassed the PO flow.
Manufacturing & job-order reports
The reports below cover the production / job-order side — cost roll-up and execution tracking against the Manufacturing Plans.
Job Order Cost
The JO Cost report rolls per-Job-Order actual cost (material + labour + overhead) over a date range with view options for summary or per-component detail.
Job Order Report
The JO Report is the operational JO-status view — planned, in-progress, completed — scoped by enterprise attribute.
MRN Adjustment
The MRN Adj (Material Receipt Note adjustment) report lists post-receipt corrections — quantity, rate and tax adjustments — with display tabs for the different adjustment categories.
Sales-plan / transaction reports
The reports below cover the sales-plan dimension — planned vs actual monthly / yearly, transaction-side rollups and the invoice-vs-payment matching view.
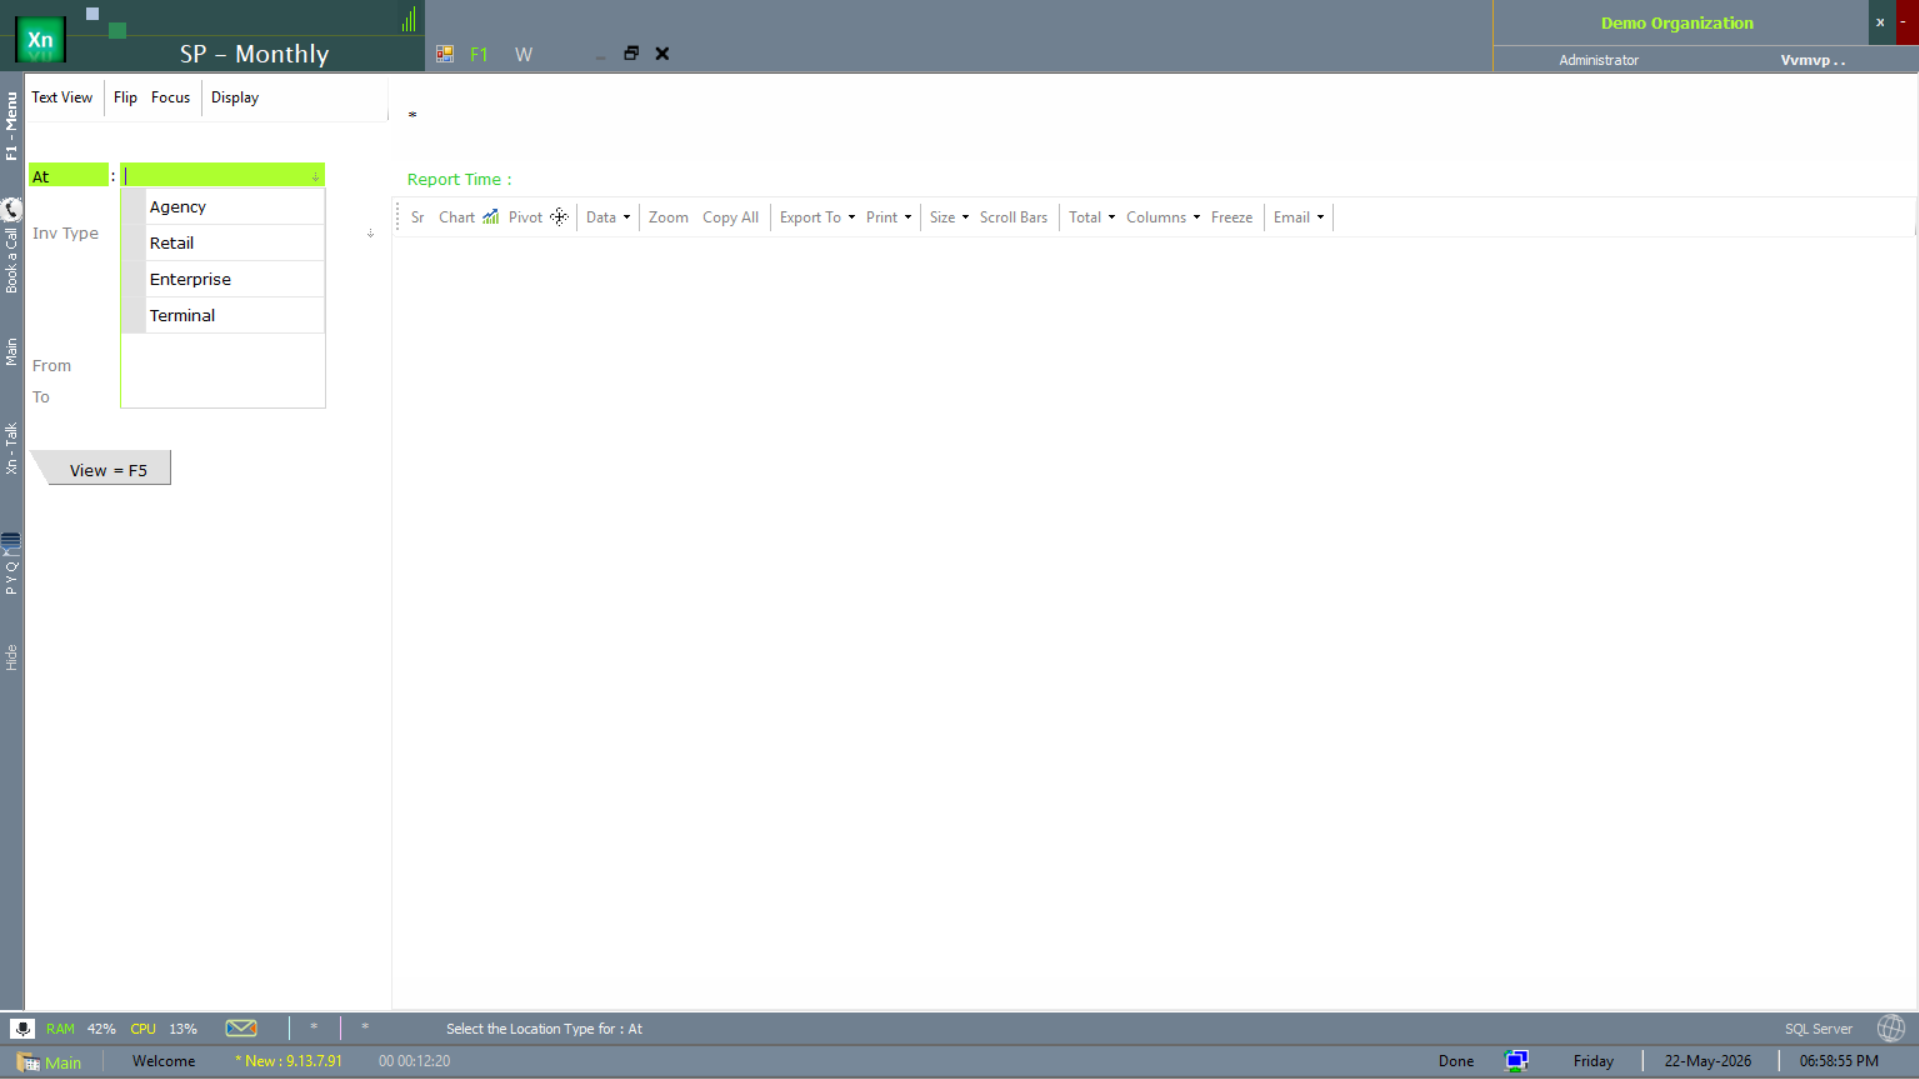
Sales Plan — Monthly
The SP - Monthly report tracks the monthly sales-plan vs actual, scoped by entity type (Agency / Retail / Enterprise / Terminal).
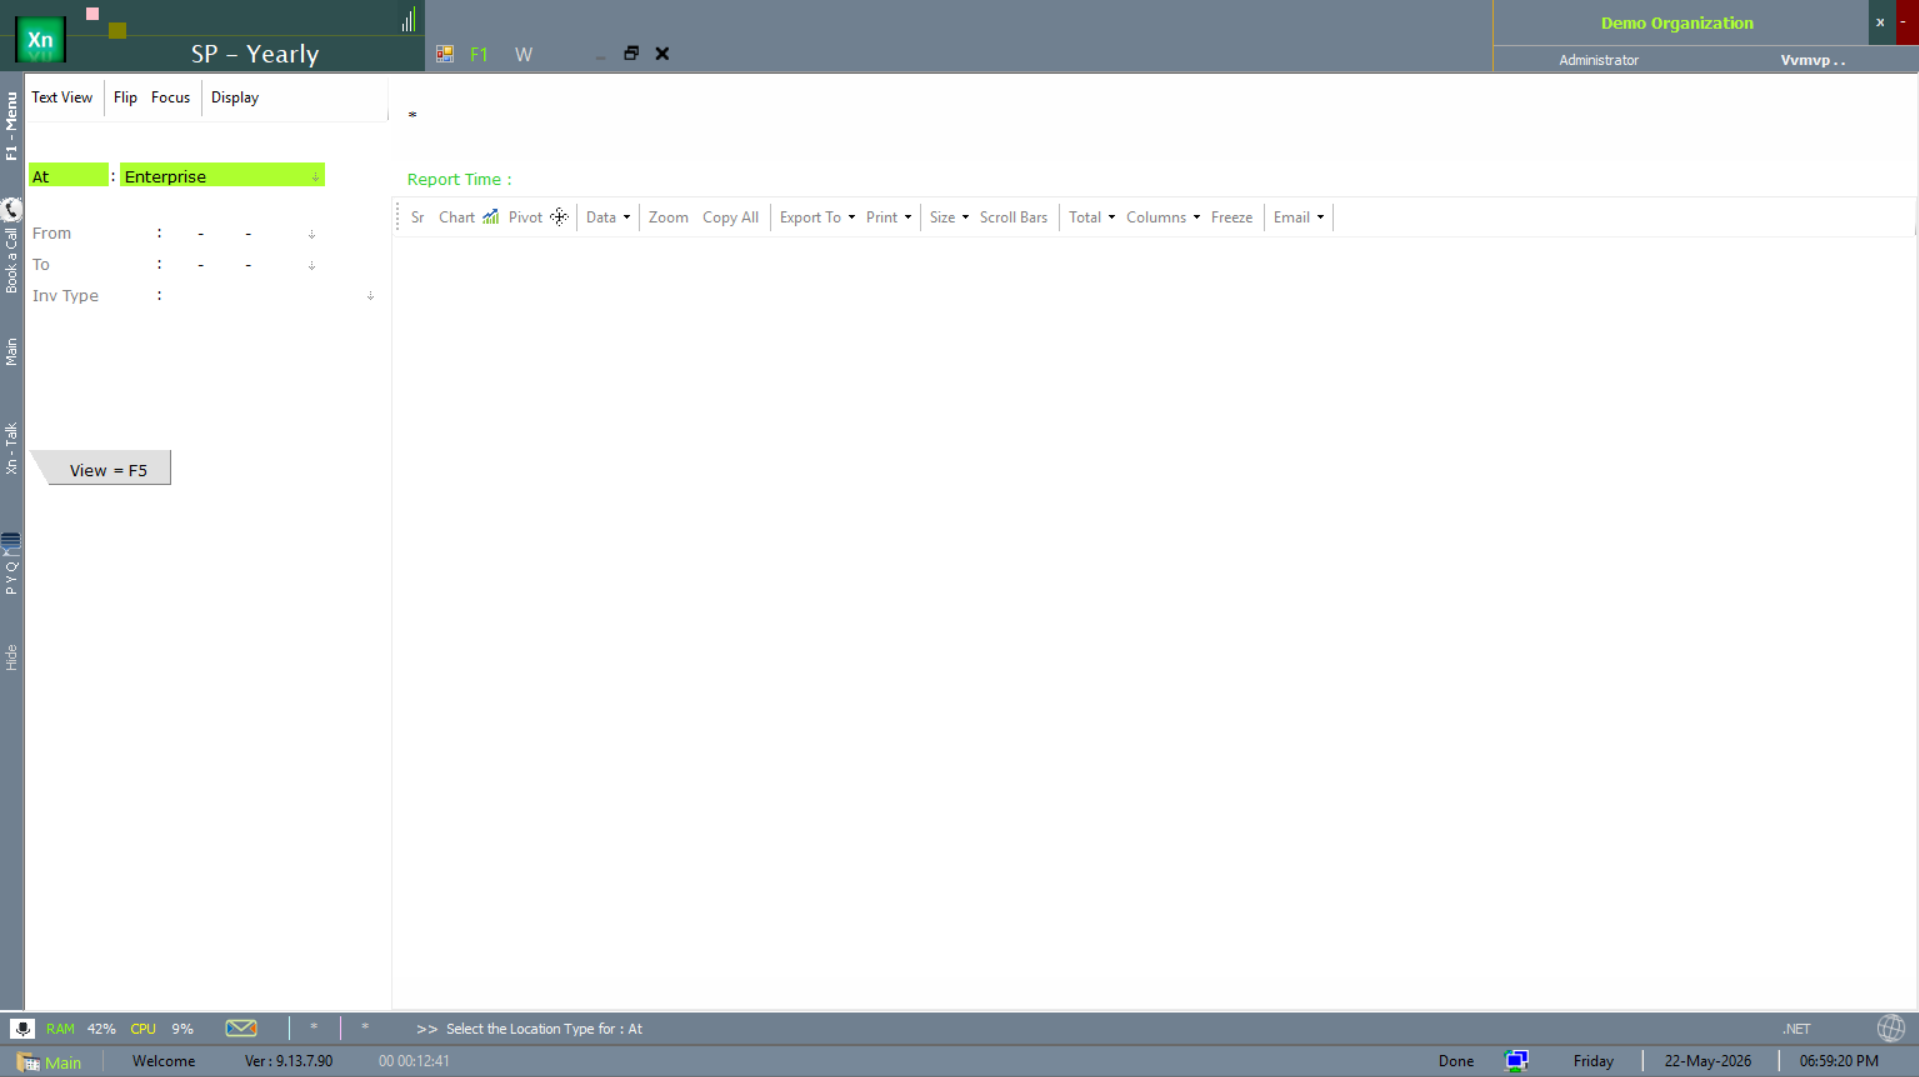
Sales Plan — Yearly
The SP - Yearly report is the annual sales-plan rollup with enterprise-attribute scope — used for budget review and target-setting.
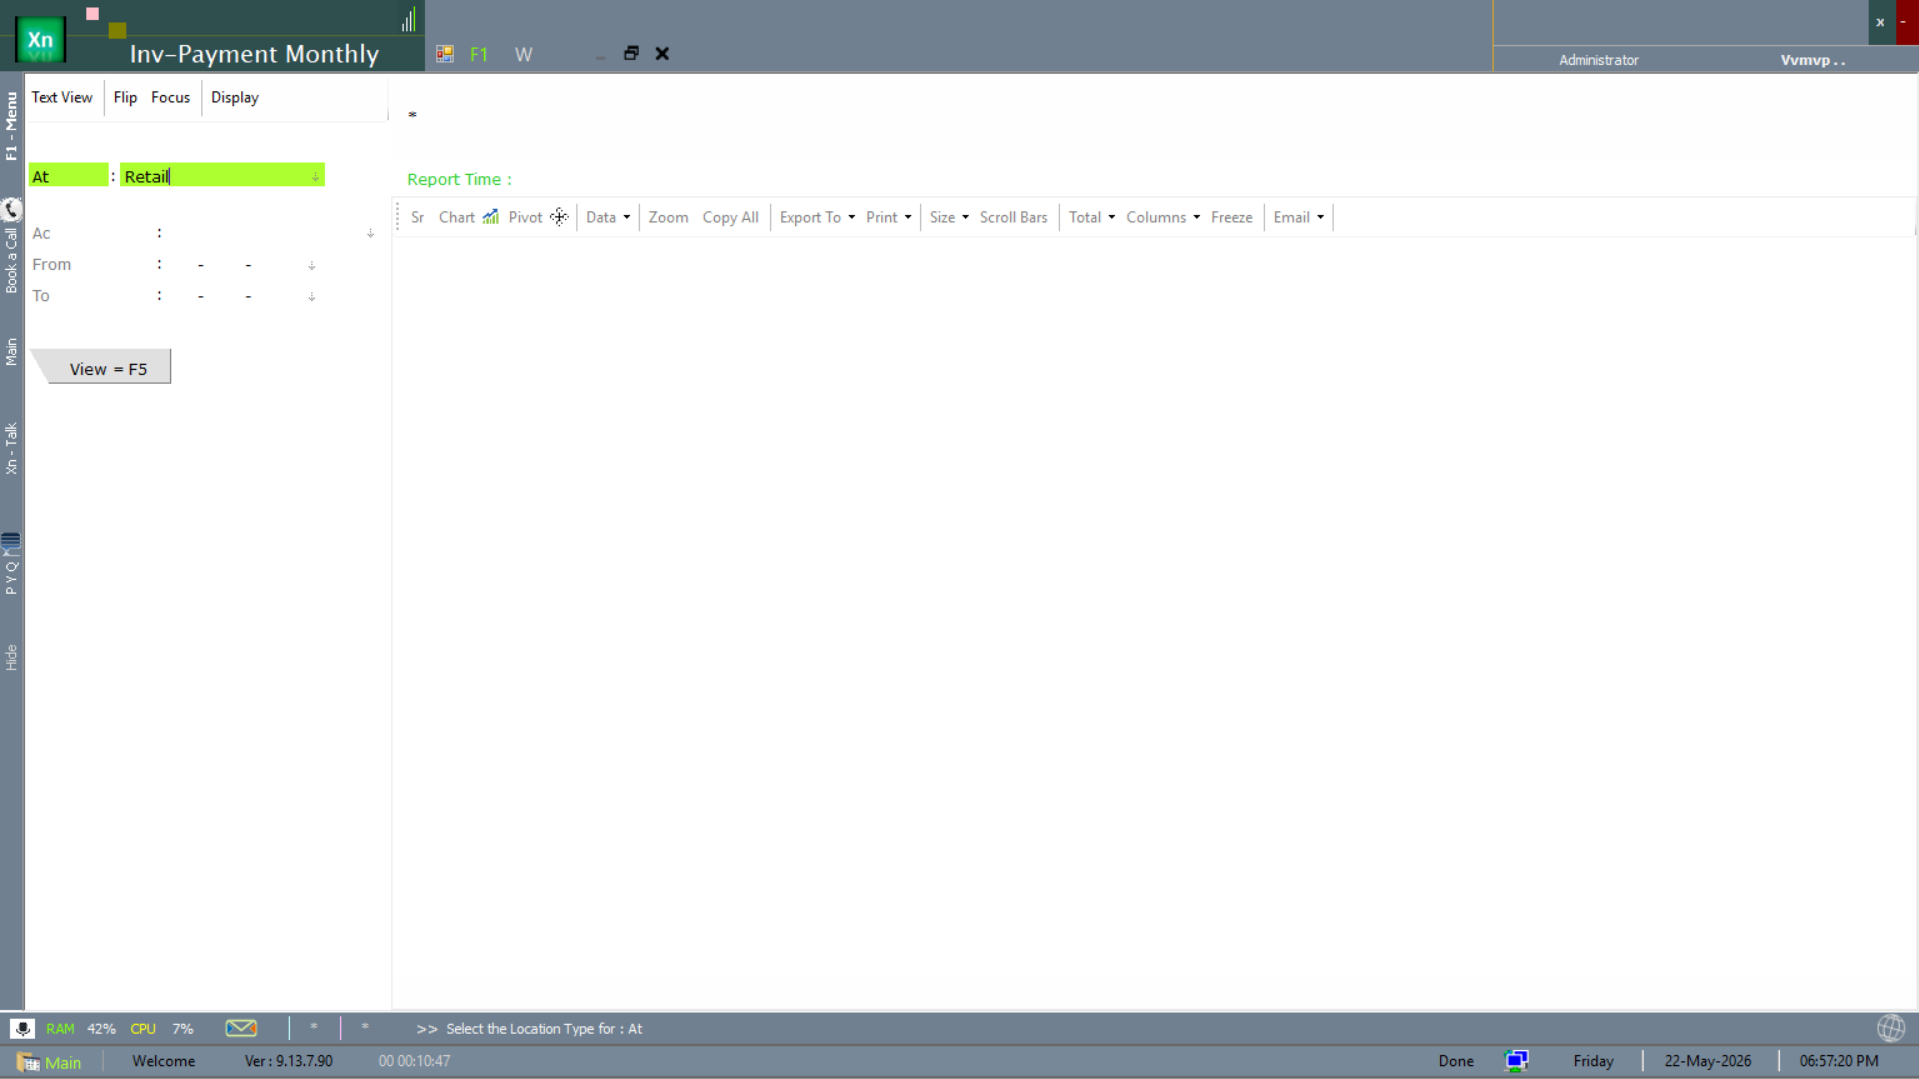
Invoice & Payment — Monthly
The Inv-Payment Monthly report matches monthly invoices against payments received, scoped by attribute (Retail in the screenshot). Highlights collection performance per period.
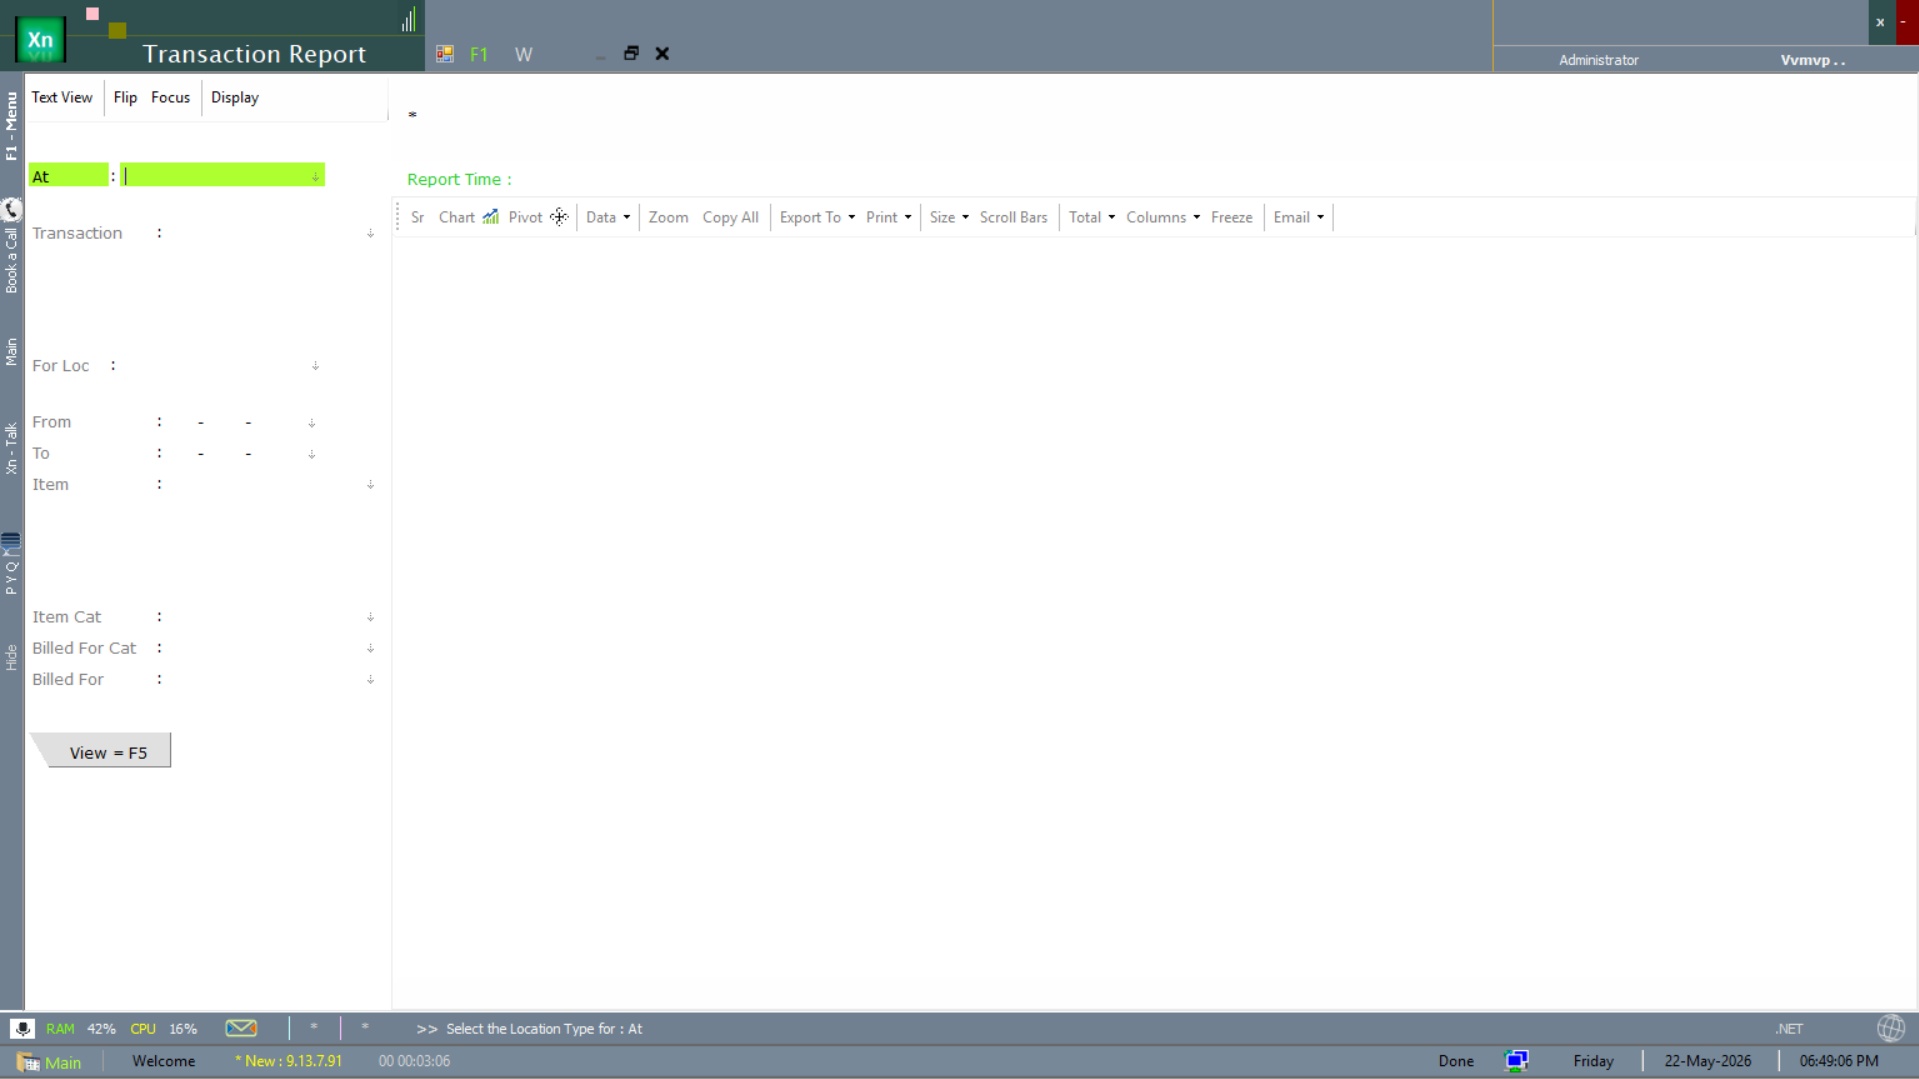
Transaction Report
The Transaction Report is the catch-all multi-dimension transaction view — the report you reach when none of the canned reports has the cut you need.
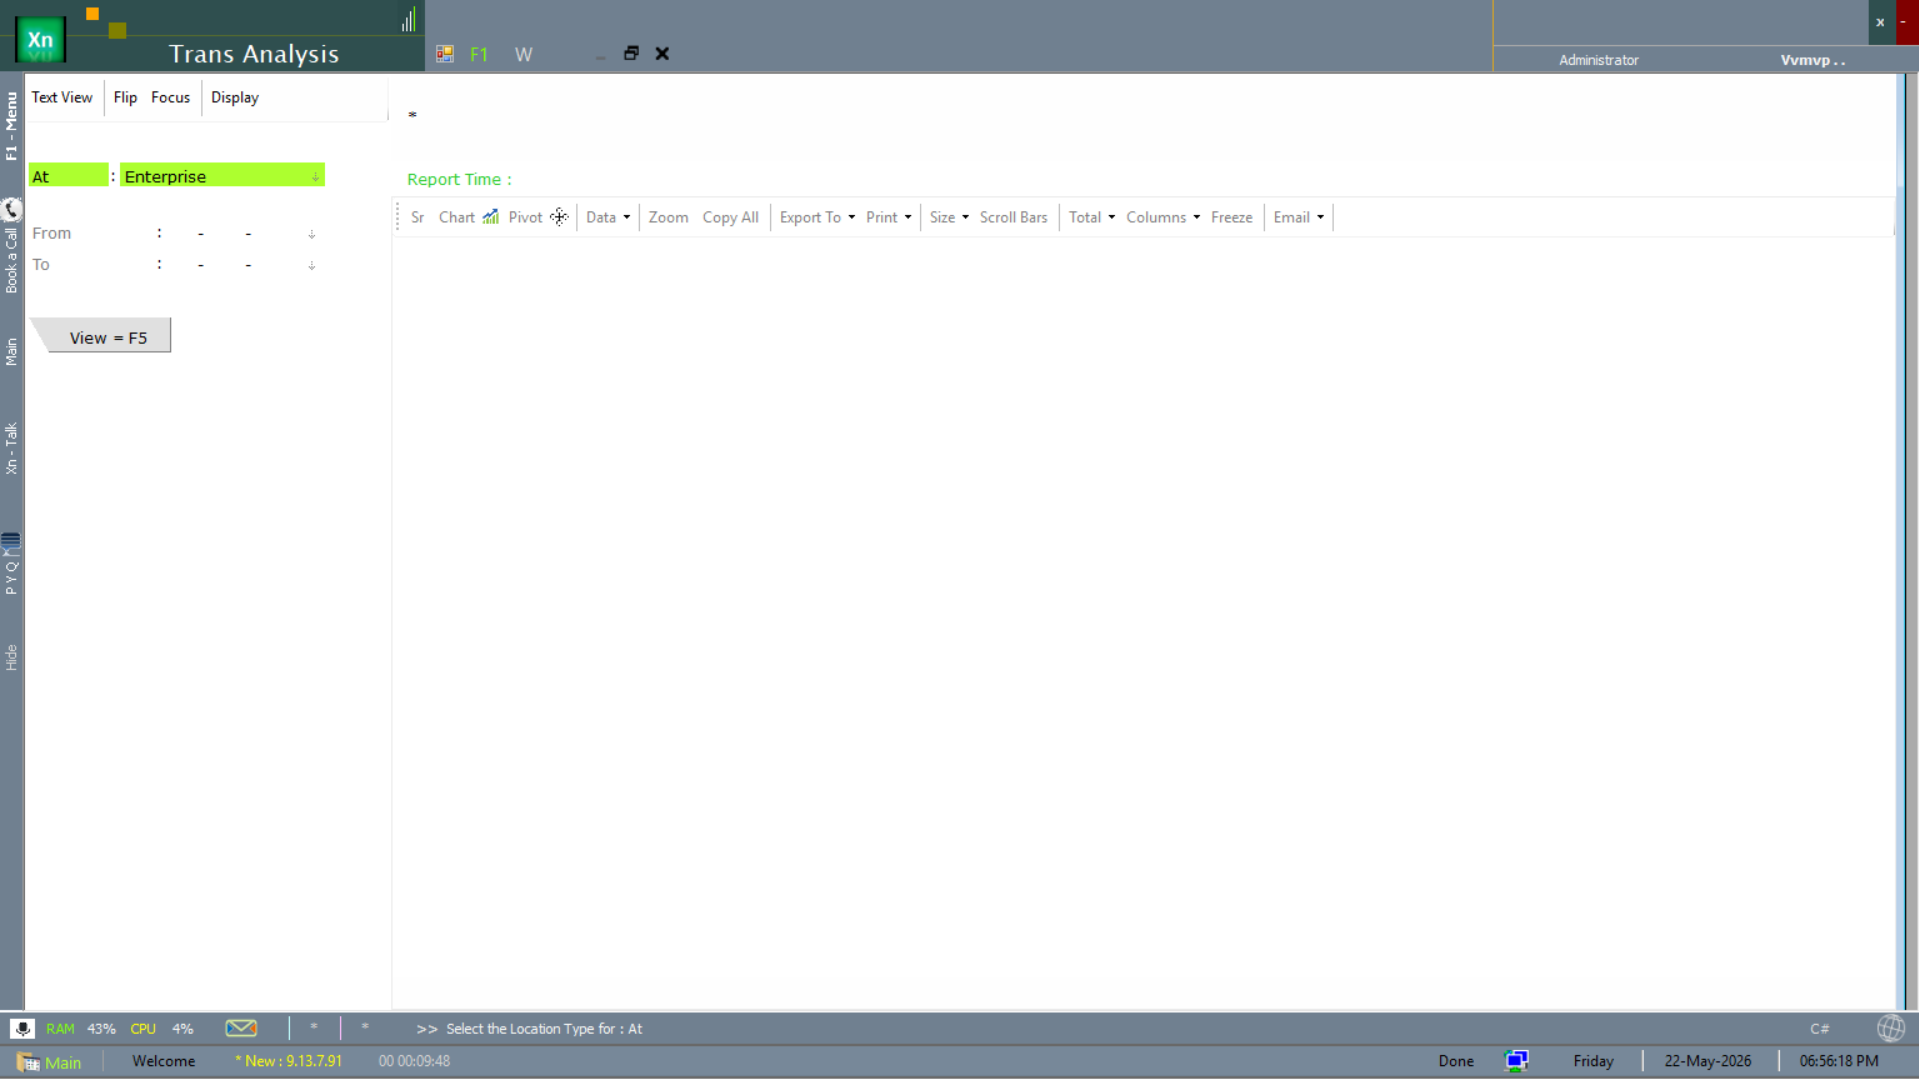
Transaction Analysis
The Trans Analysis screen is the analytical cut of transaction data — pivot / chart / time-series — scoped by enterprise attribute.
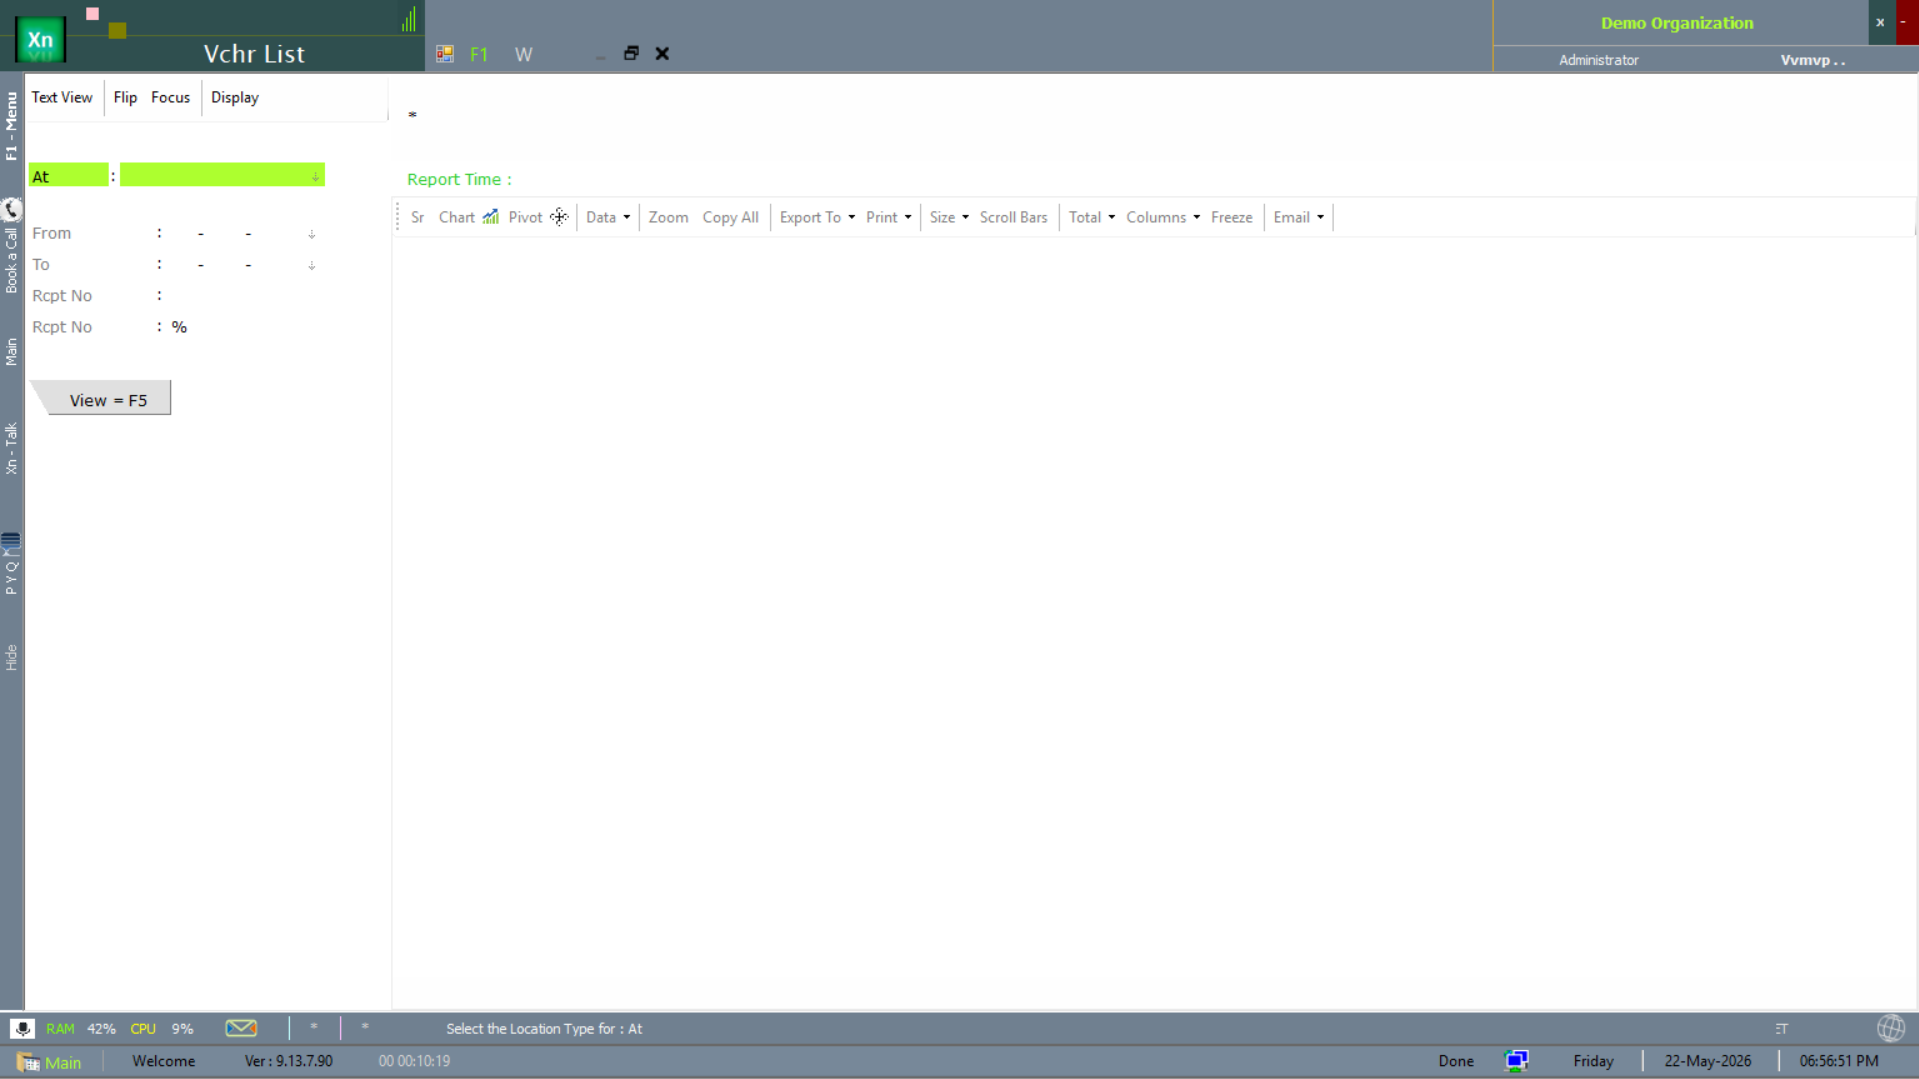
Voucher List (Vchr List)
The Vchr List screen is a receipt-number filterable list of every voucher posted in a period — the auditor's look-up screen.
Pendings (all)
The Pendings report is the unified open-items view — bills, receipts, vouchers awaiting action across the system. The morning to-do list for the accounts team.

Regulatory & external-system reports
The reports below interface with regulators and external systems — Tally export, Sch-H1 sales (pharma-regulator filing), expiry tracking and the meter / sensor reading records used in plantation / utility installations.
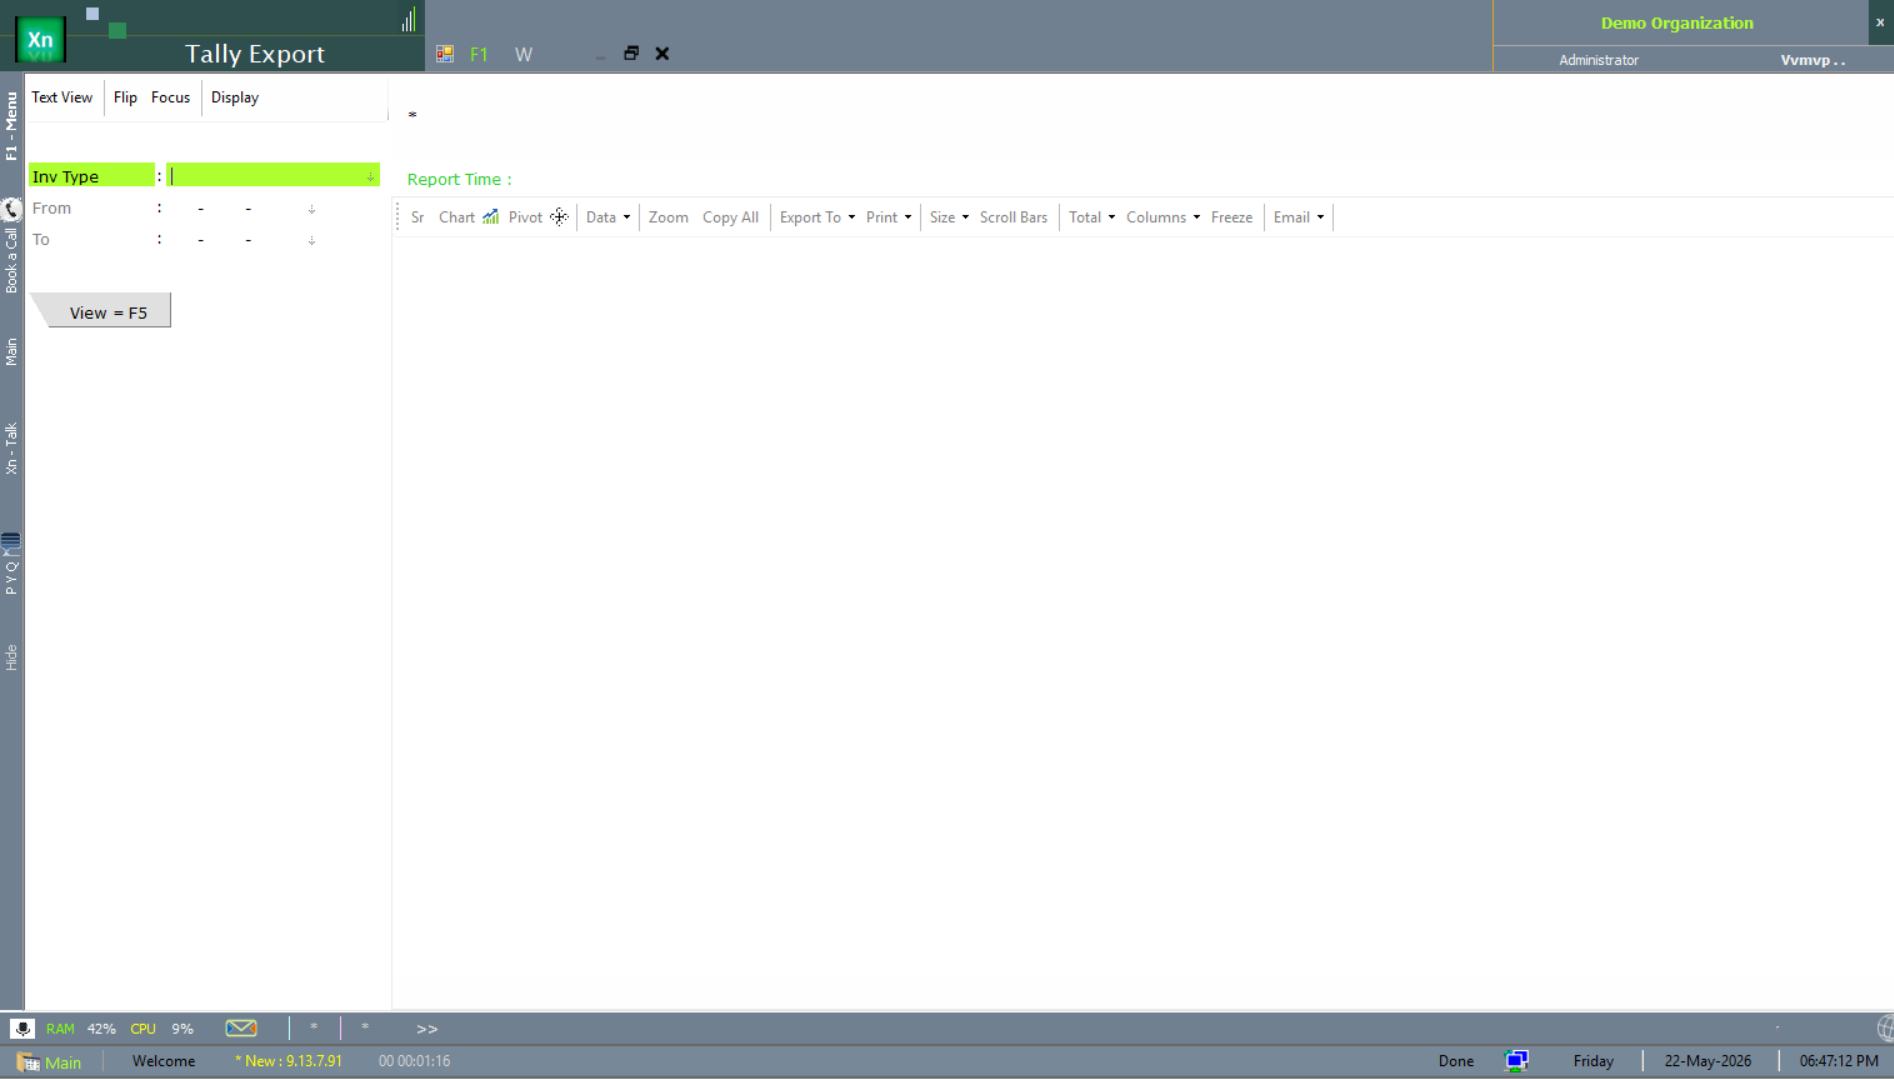
Tally Export
The Tally Export screen produces the XML payload Tally Prime / ERP imports — for installations that keep Tally as the parallel accounting record (typical during a phased ZN ERP roll-out).
Sch-H1 Sale (pharma regulatory)
The Sch-H1 Sale report produces the Schedule-H1 sales register required by drug regulators — per-batch sales of restricted Schedule-H1 molecules.

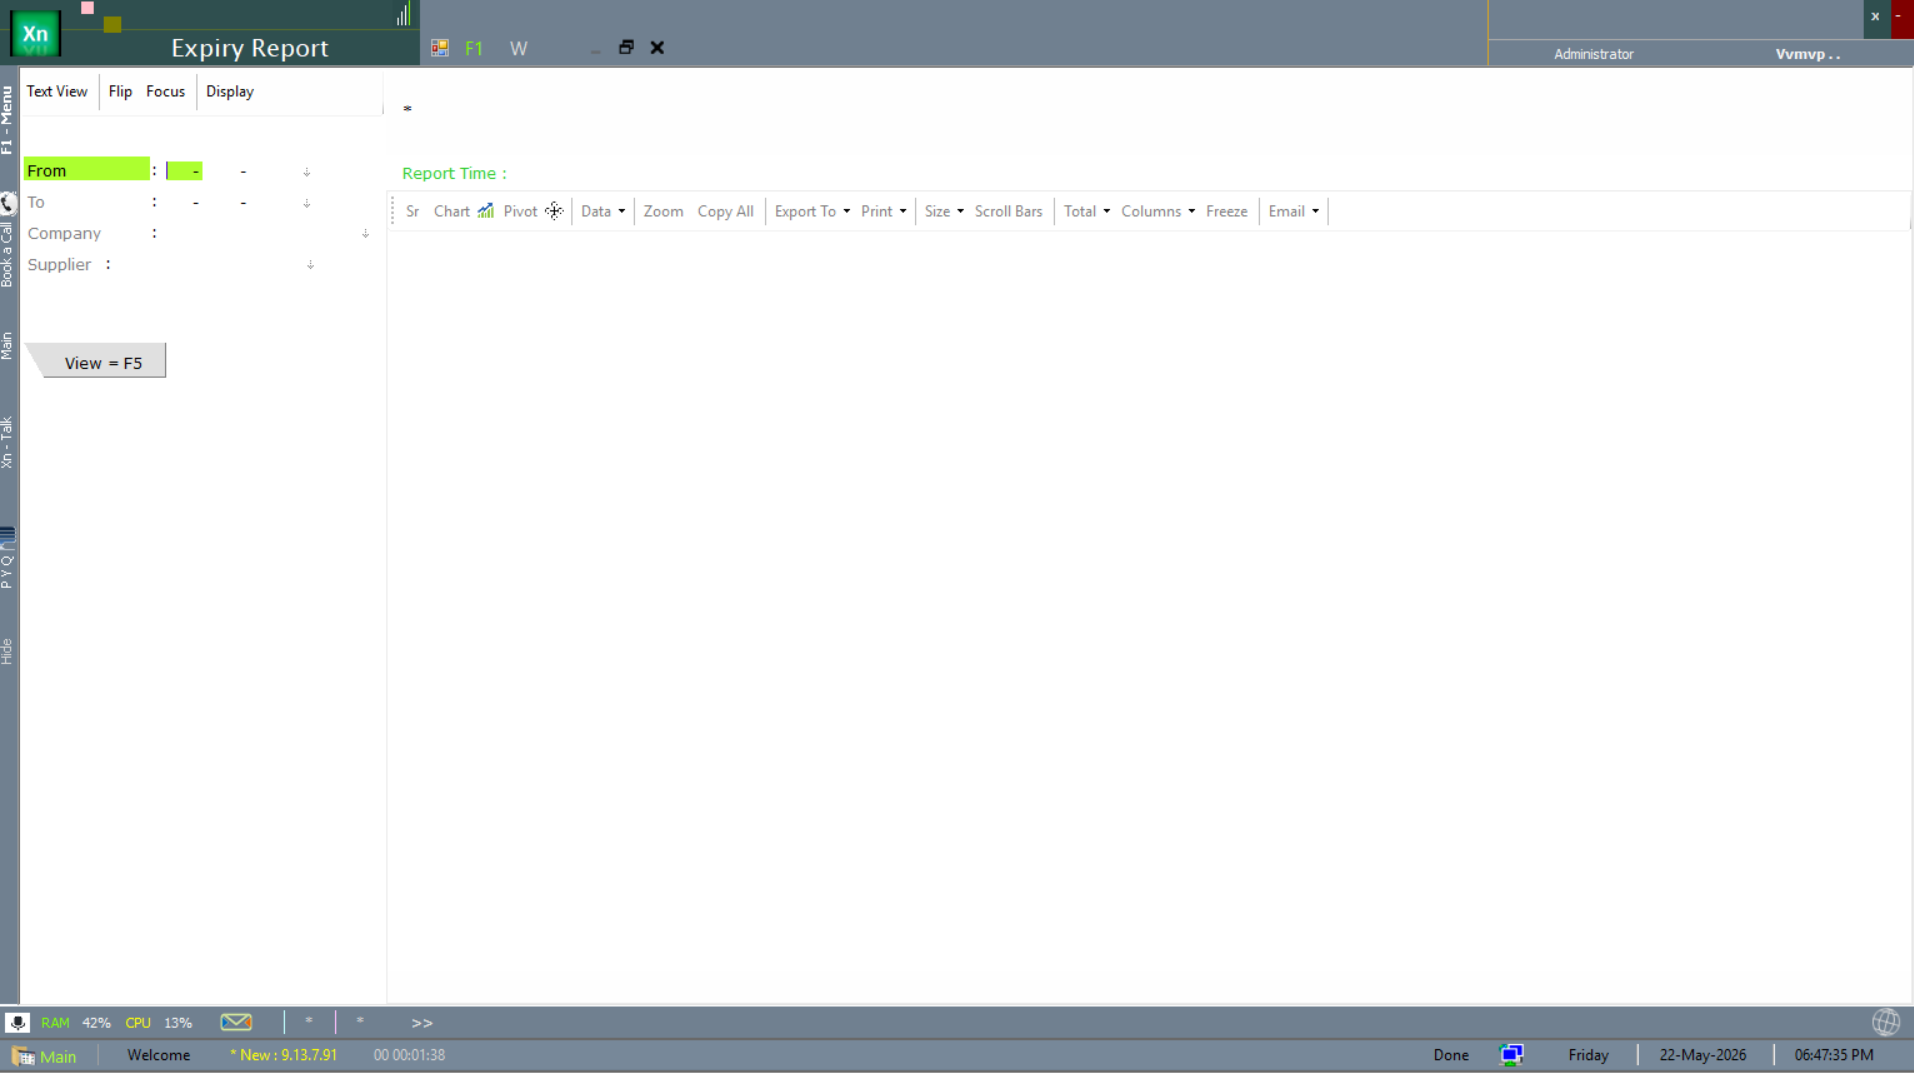
Expiry Report (regulatory)
The Expiry Report here is the regulatory-filing variant — near-expiry and expired batches presented in the format your regulator expects.
Reading Records
The Reading Records report covers meter / sensor reading capture — common in plantation, dairy, utility and weighing-scale installations. Pair with the Reading Records 2 secondary variant for installations that track two reading sources.


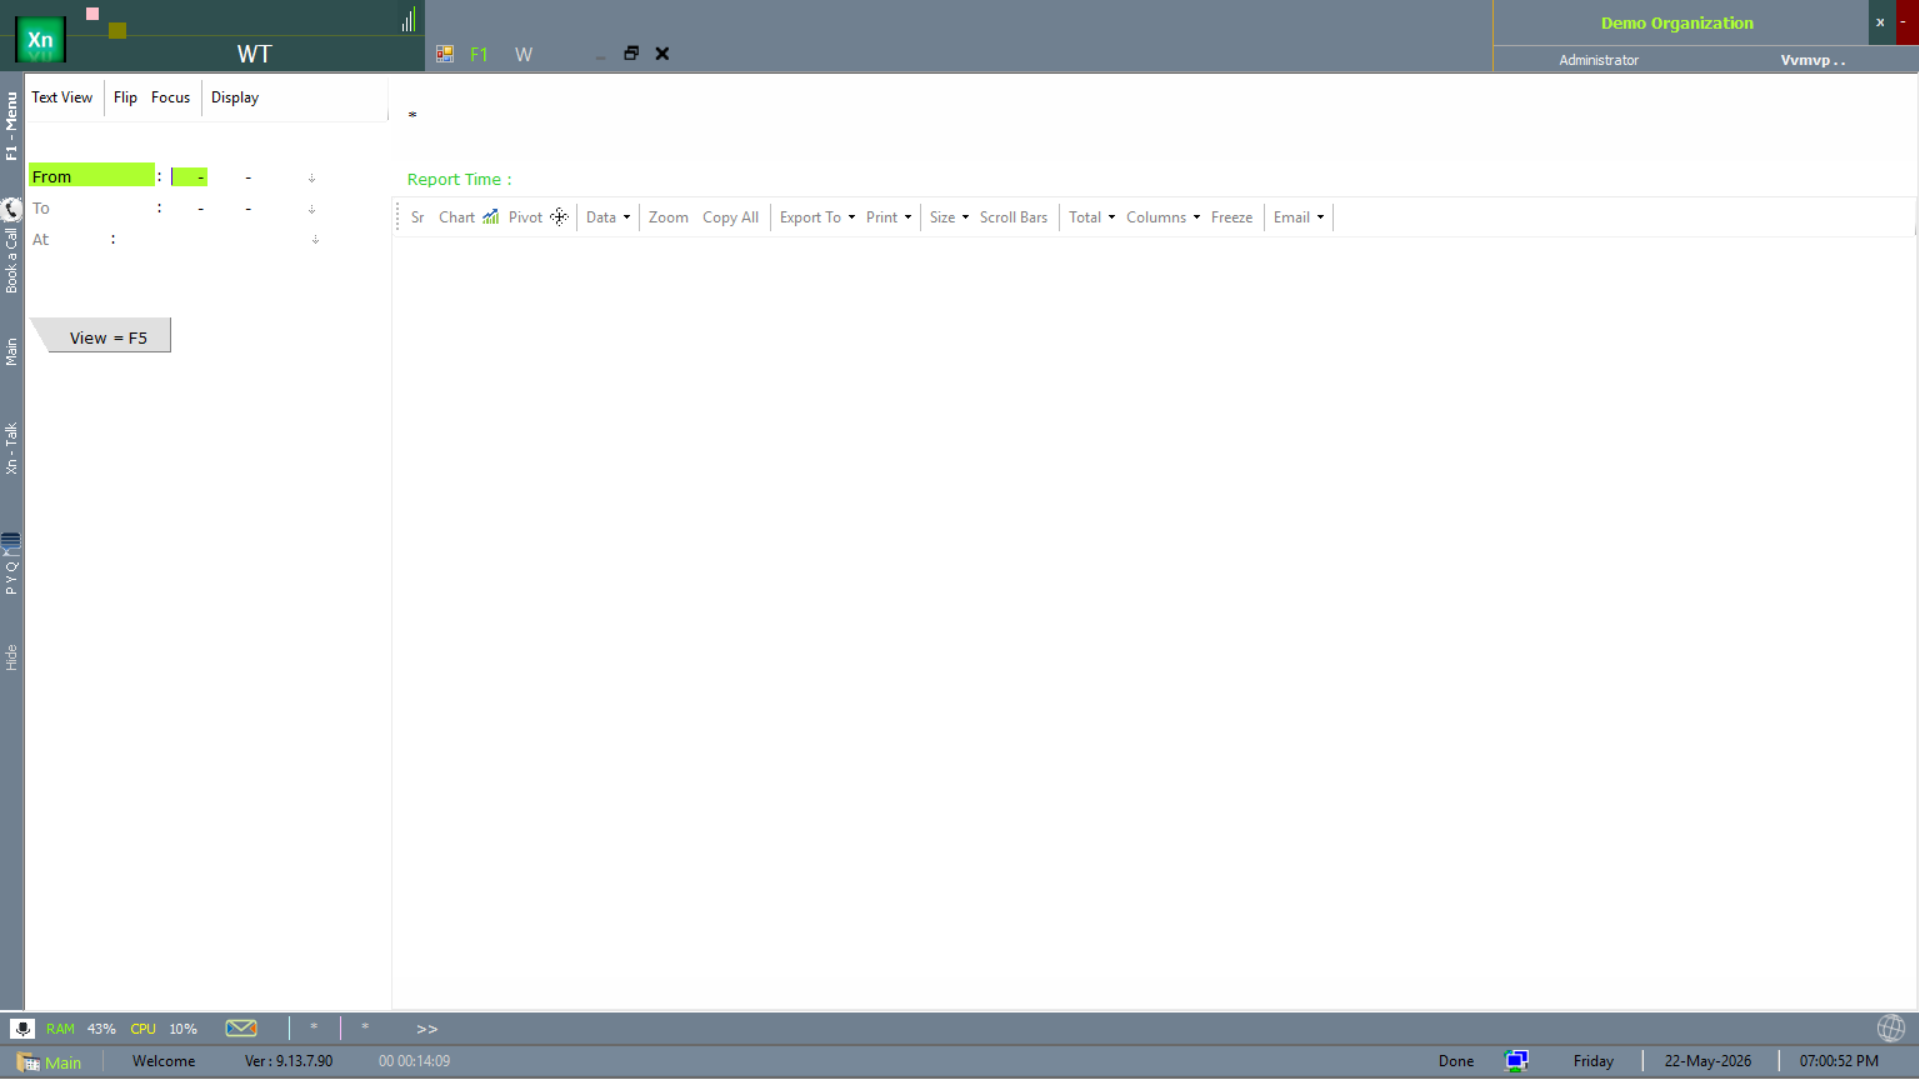
Weight Tracking (WT)
The WT report tracks weighbridge / weighing-scale captures over time — standard in scrap, agri-commodity and bulk-transport installations where weight is the unit of trade.