Stock Reports
Position-as-on, item ledger, batch ledger, valuation and exception reports.
Overview
Stock Reports is the readout side of inventory. Most operational queries — "how much do we have", "where did this batch go", "what is expiring", "what is not moving" — are answered here. Every report supports the standard filter set (item / category / location / date range) and exports to PDF and Excel.
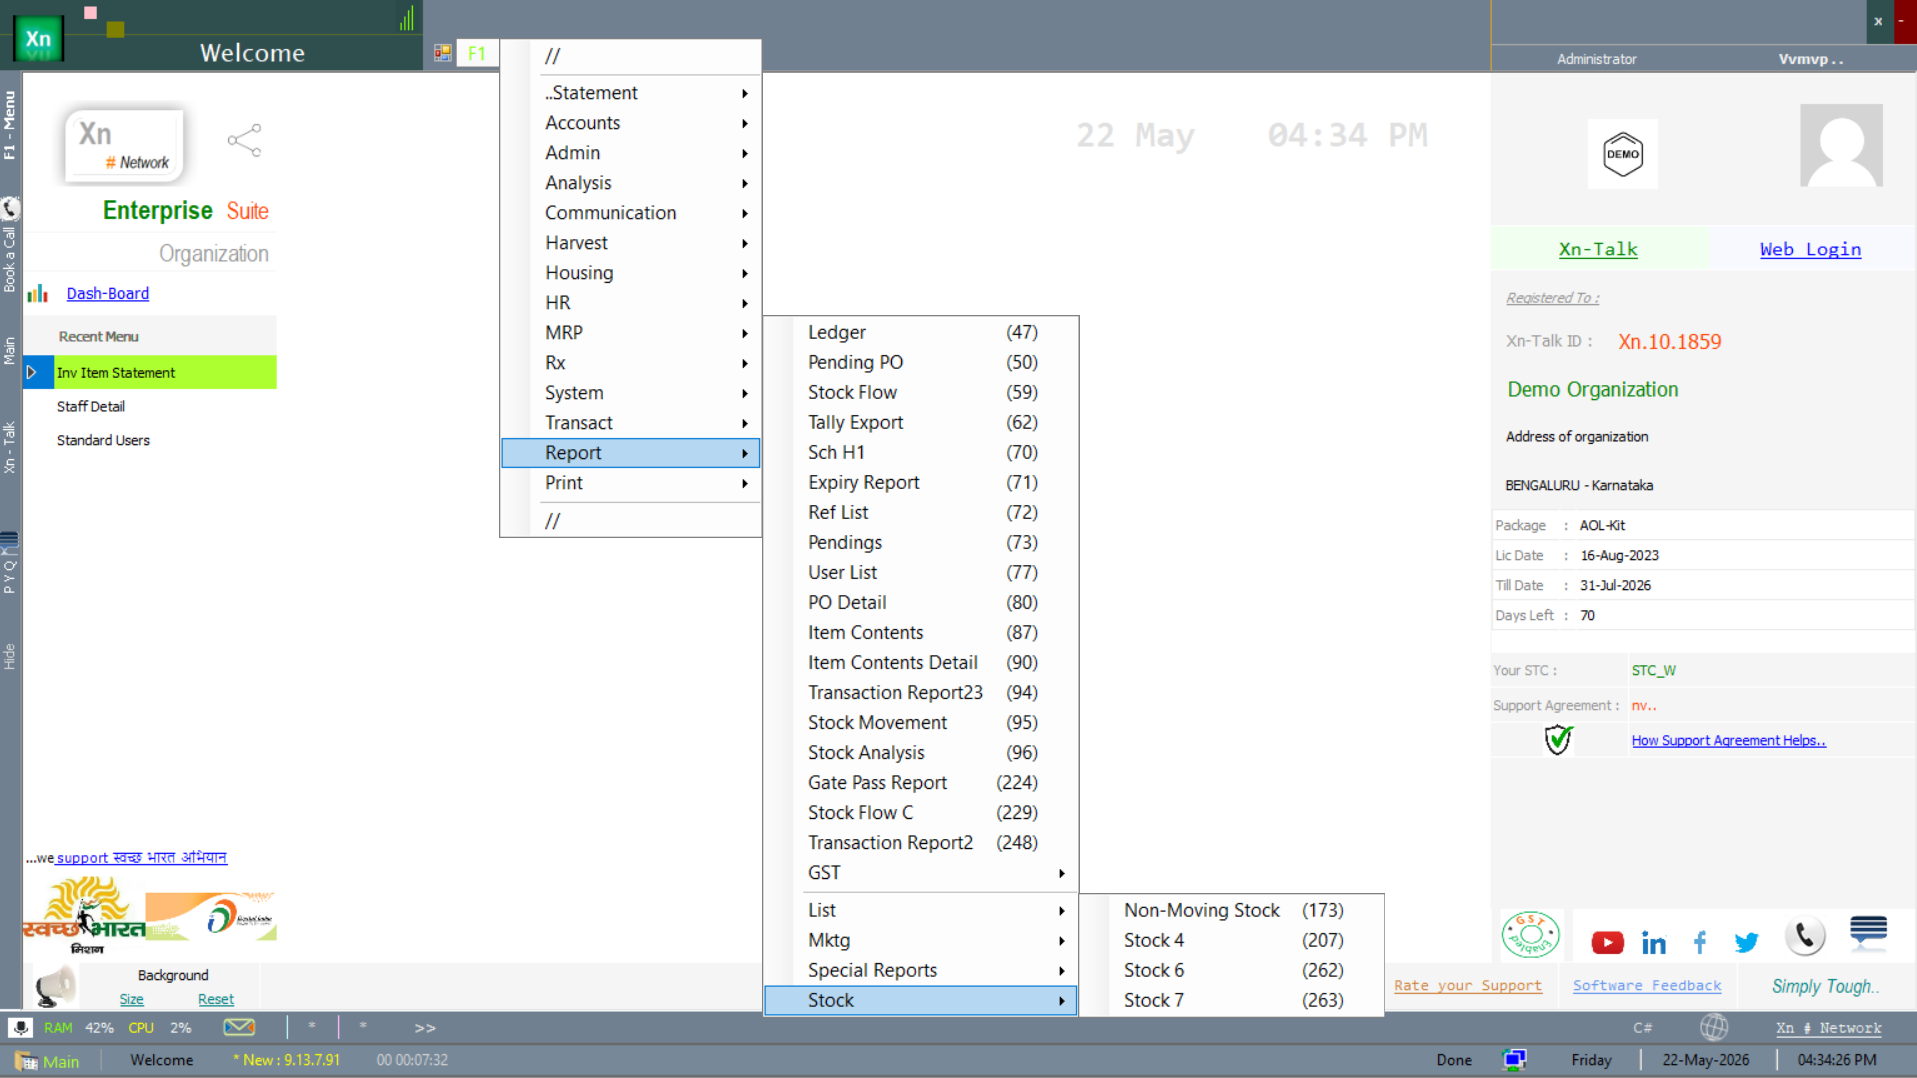
Stock Reports menu
The stock-side reports live under the Reports branch of the Welcome screen. Hover the menu to see the full set — movement, flow, analysis, valuation, ageing and the family of stock-position variants below.
Stock as on Date
Definitive stock figure at a point in time, location-wise or company-wide. Use this for audit, year-end and any reconciliation work — it is the only stock report that is guaranteed deterministic regardless of when you run it. Export to Excel for sign-off; the PDF carries a footer with the user and timestamp so the document is traceable.
Three filter variants of the position report are shipped, depending on how much you want to slice it before the report runs:
Stock position — by location
The simplest variant. Pick a location in At (or leave blank for the whole organisation) and hit View = F5. Use this for the daily "what do I have where" question.
Stock position — by business type
Same position report scoped by For (business type — Retail, Wholesale, etc.). Use it when a chain runs multiple formats from a single ZN ERP install and you want only one format's stock.

Stock position — by item type
The most granular variant. Adds Item Type and Item filters on top of At, so you can ask "what raw material X do we have at location Y right now" without scrolling through everything else.

Item Ledger
Every inward and outward movement for one item with running balance and document reference. Click any row to open the source statement. The ledger respects all statements including conversions and adjustments, so the closing balance always agrees with Stock as on Date for the same end-date.
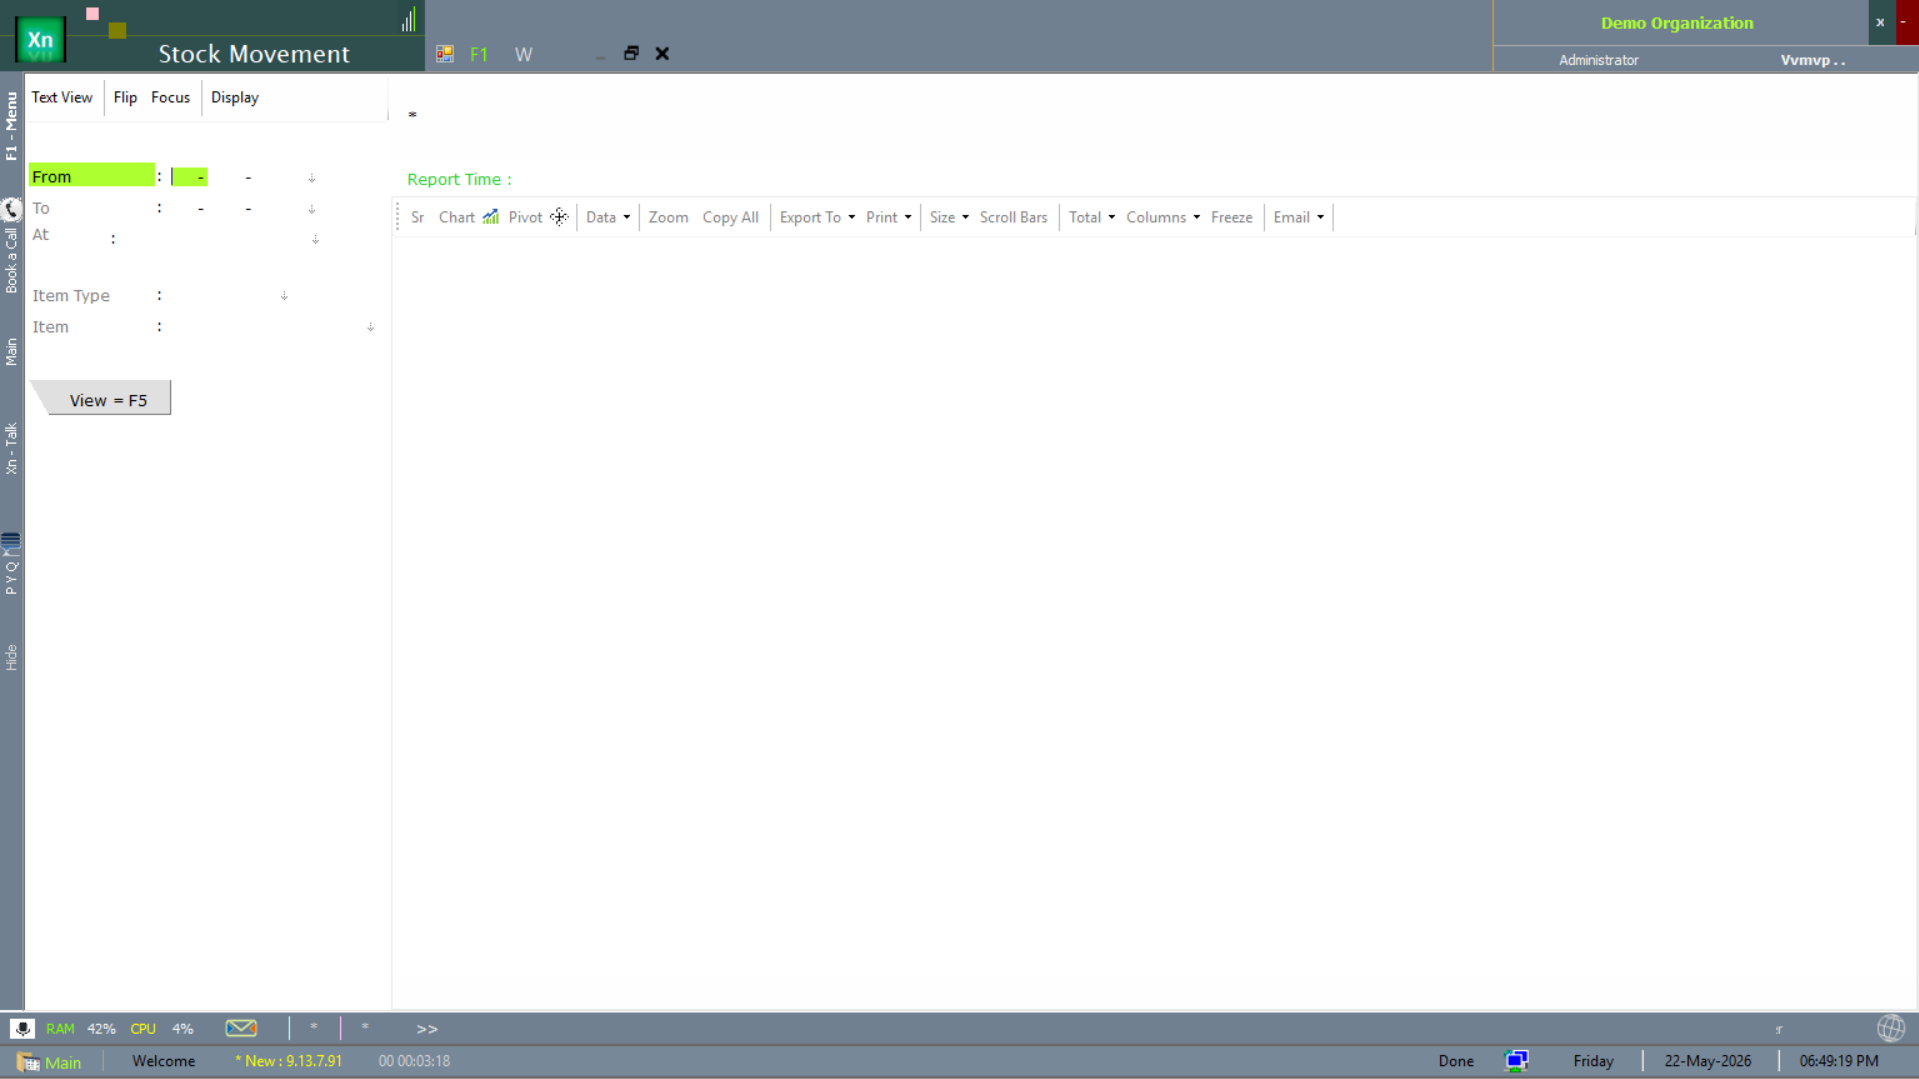
Stock Movement
The Stock Movement report is the multi-item version of the Item Ledger — every IN/OUT movement across the chosen range, with document reference. Use it when investigating a discrepancy that spans more than one item.
Stock Flow
The Stock Flow report rolls movement up into in / out / net columns per item — useful for spotting items whose net flow is unexpected (heavy outflow without sales, heavy inflow without purchase orders).

Batch Ledger
The Item Ledger broken down by batch, showing batch number, expiry, MRP and remaining quantity at each row. Essential for pharma, food and chemical installations where regulators require batch traceability. Combined with the Expiry Alert it is a complete FIFO-by-expiry workflow.
Stock Valuation
Current stock multiplied by cost, computed according to the valuation method configured in Setup (Weighted Average, FIFO or Standard). Use the date filter to see valuation at the close of any month. Total here ties to the inventory ledger balance in Accounts — investigate any difference immediately.
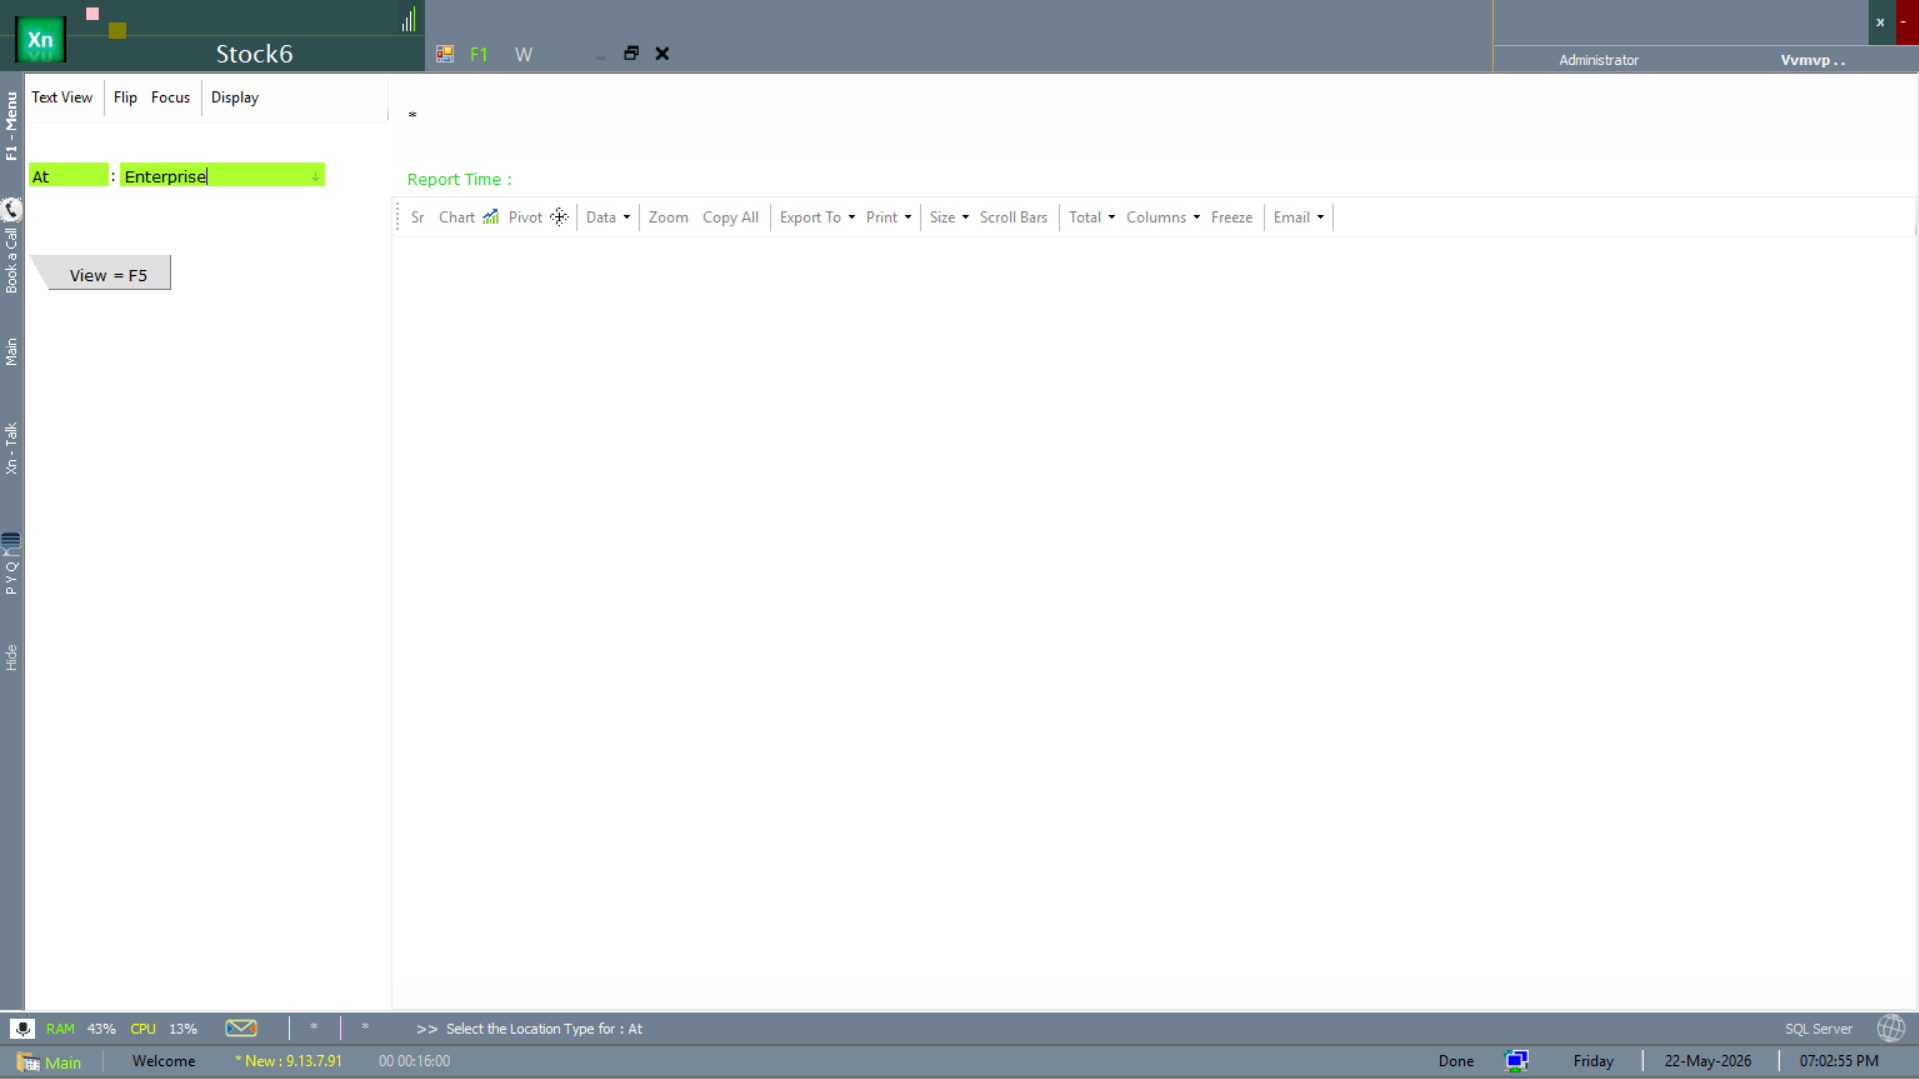
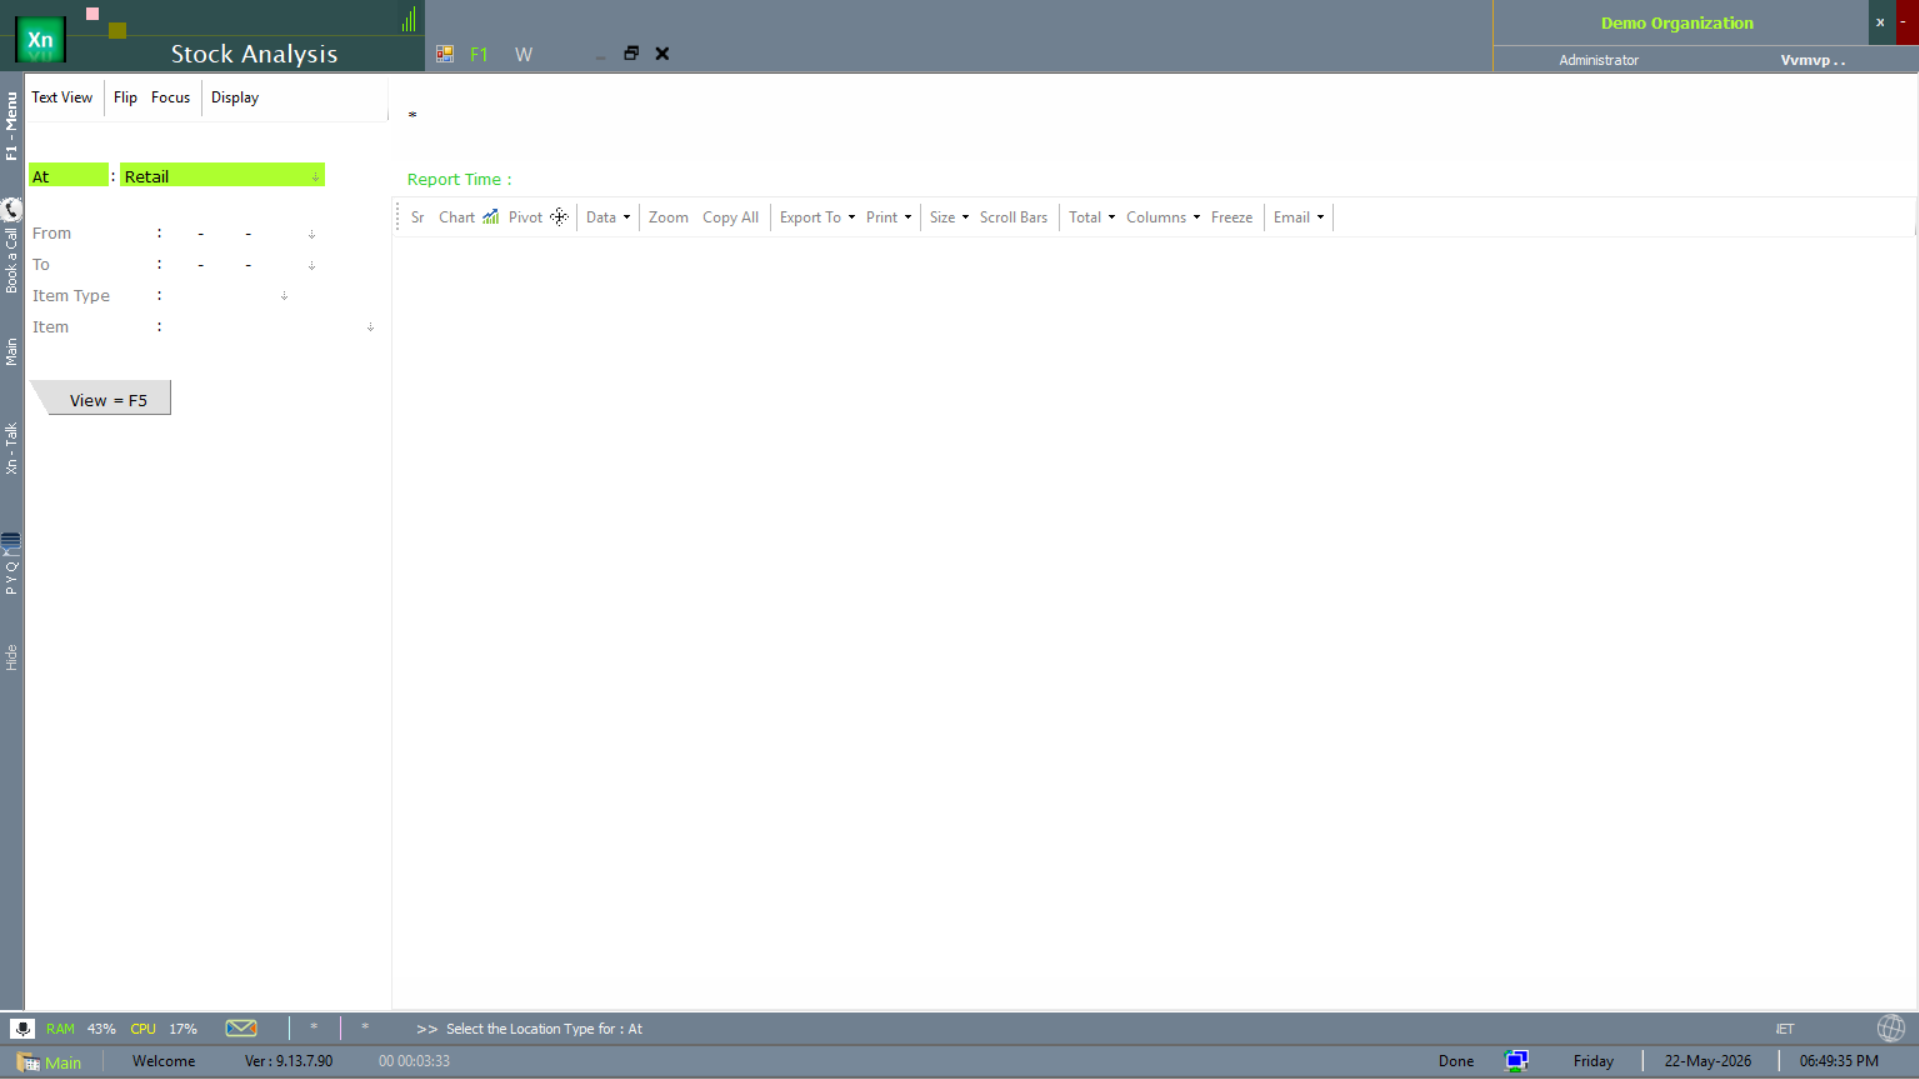
Stock Analysis
The Stock Analysis report cuts the same on-hand quantity multiple ways (by category, by supplier, by margin band, by ABC class) so the operations head can spot patterns the position report does not surface. Treat it as the dashboard view that the ABC / Pareto and Slow-Moving reports drill into.
Slow Moving / Non Moving
Items with no movement in N days (configurable). Each row carries the on-hand quantity, value and days-since-last-movement. The non-moving list is the prime candidate set for clearance pricing, write-off and item rationalisation.
Non-Moving Stock report
The Non-Moving Stock report is the operational version. Pick At (location) and From Days (e.g. 90 to flag items idle for three months), then View = F5. The result list feeds straight into clearance pricing or write-off workflows.
Expiry Alert
Batches expiring within configurable windows (commonly 30 / 60 / 90 days). Colour-coded rows make the urgent ones obvious. The report links straight to Damage / Expiry Write-Off so action is one click away.
Physical Stock Variance
Compares the physically counted stock (imported from the count app or a CSV) against book stock and shows the difference per item. Approve the variance to auto-post a Stock Adjustment for the entire sheet — saves hours at month-end.
ABC / Pareto Report
Items contributing 80% of value, 80% of volume, 80% of margin or 80% of stock-out events. Useful for prioritisation — planner attention, counting cycle, supplier review — should all favour A-class items.