Analysis
Sales and purchase analytics by item, customer and period.
Overview
The Analysis area is the reporting side of the commercial cycle. It is what owners and category managers look at most — what sold, what didn't, where the margin came from. All reports support date-range, location, category and customer-group filters, plus side-by-side period comparison.
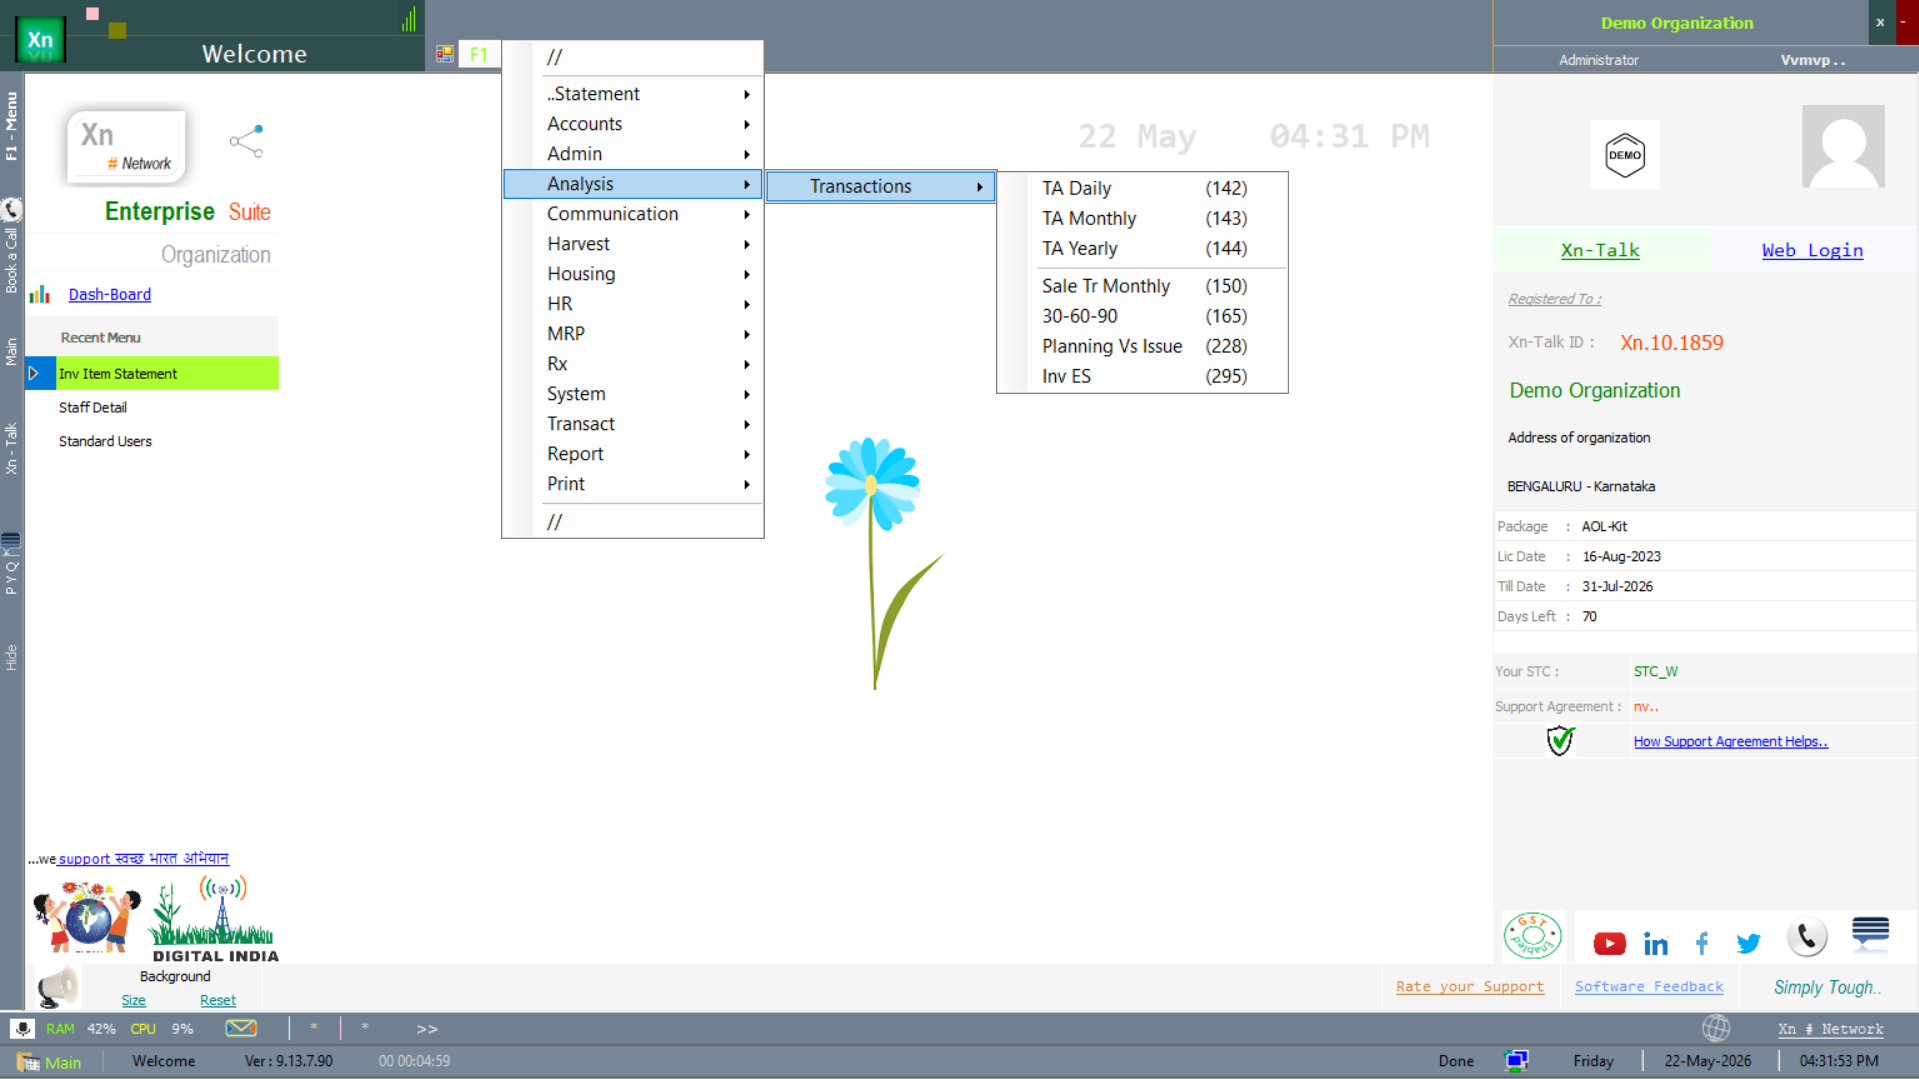
Analysis menu
The analysis screens live under the Analysis branch of the Welcome screen — transaction analysis (daily, monthly, yearly), sales analytics, budget, and the various comparison views below.
Sales Summary
Total sales by day / month / year, split by location, tax slab, customer group or any other dimension. Date-comparison mode shows current period side-by-side with the previous period and the same period last year. Drill into a cell to see the underlying invoices.
Item-wise Sales
Top-selling items and slow-movers for a period, sortable by quantity, value or margin. The category filter lets you focus on one product family at a time; the export carries the same slicing for further work in Excel.
Customer-wise Sales
Ranked list of customers by revenue, with comparison vs the previous period to highlight growth and churn. Click a customer to open the customer ledger and the full transaction history.
Purchase Summary
Mirror of Sales Summary for purchases. Useful for spotting concentration risk (too much spend with one supplier) and for procurement budget vs actual.
Supplier-wise Purchase
Top suppliers by spend with period-over-period comparison. Pair with Supplier Performance under Special Reports for the qualitative side — quality, on-time delivery, lead-time accuracy.
Margin Analysis
Gross margin per item, per category, per customer or per branch. The standard report category managers live in. Negative margins are highlighted; sort ascending to find the worst offenders.
Trend Charts
Visual line, bar and pie charts on top of the above reports. Useful for management slides and dashboards. Same drill behaviour as the table reports — click a slice or bar to open the contributing rows.
Comparison and planning views
The reports below are the comparison-style analysis screens — budget vs actual, ageing, plan vs issue, period vs period — that owners and planners reach for during reviews.
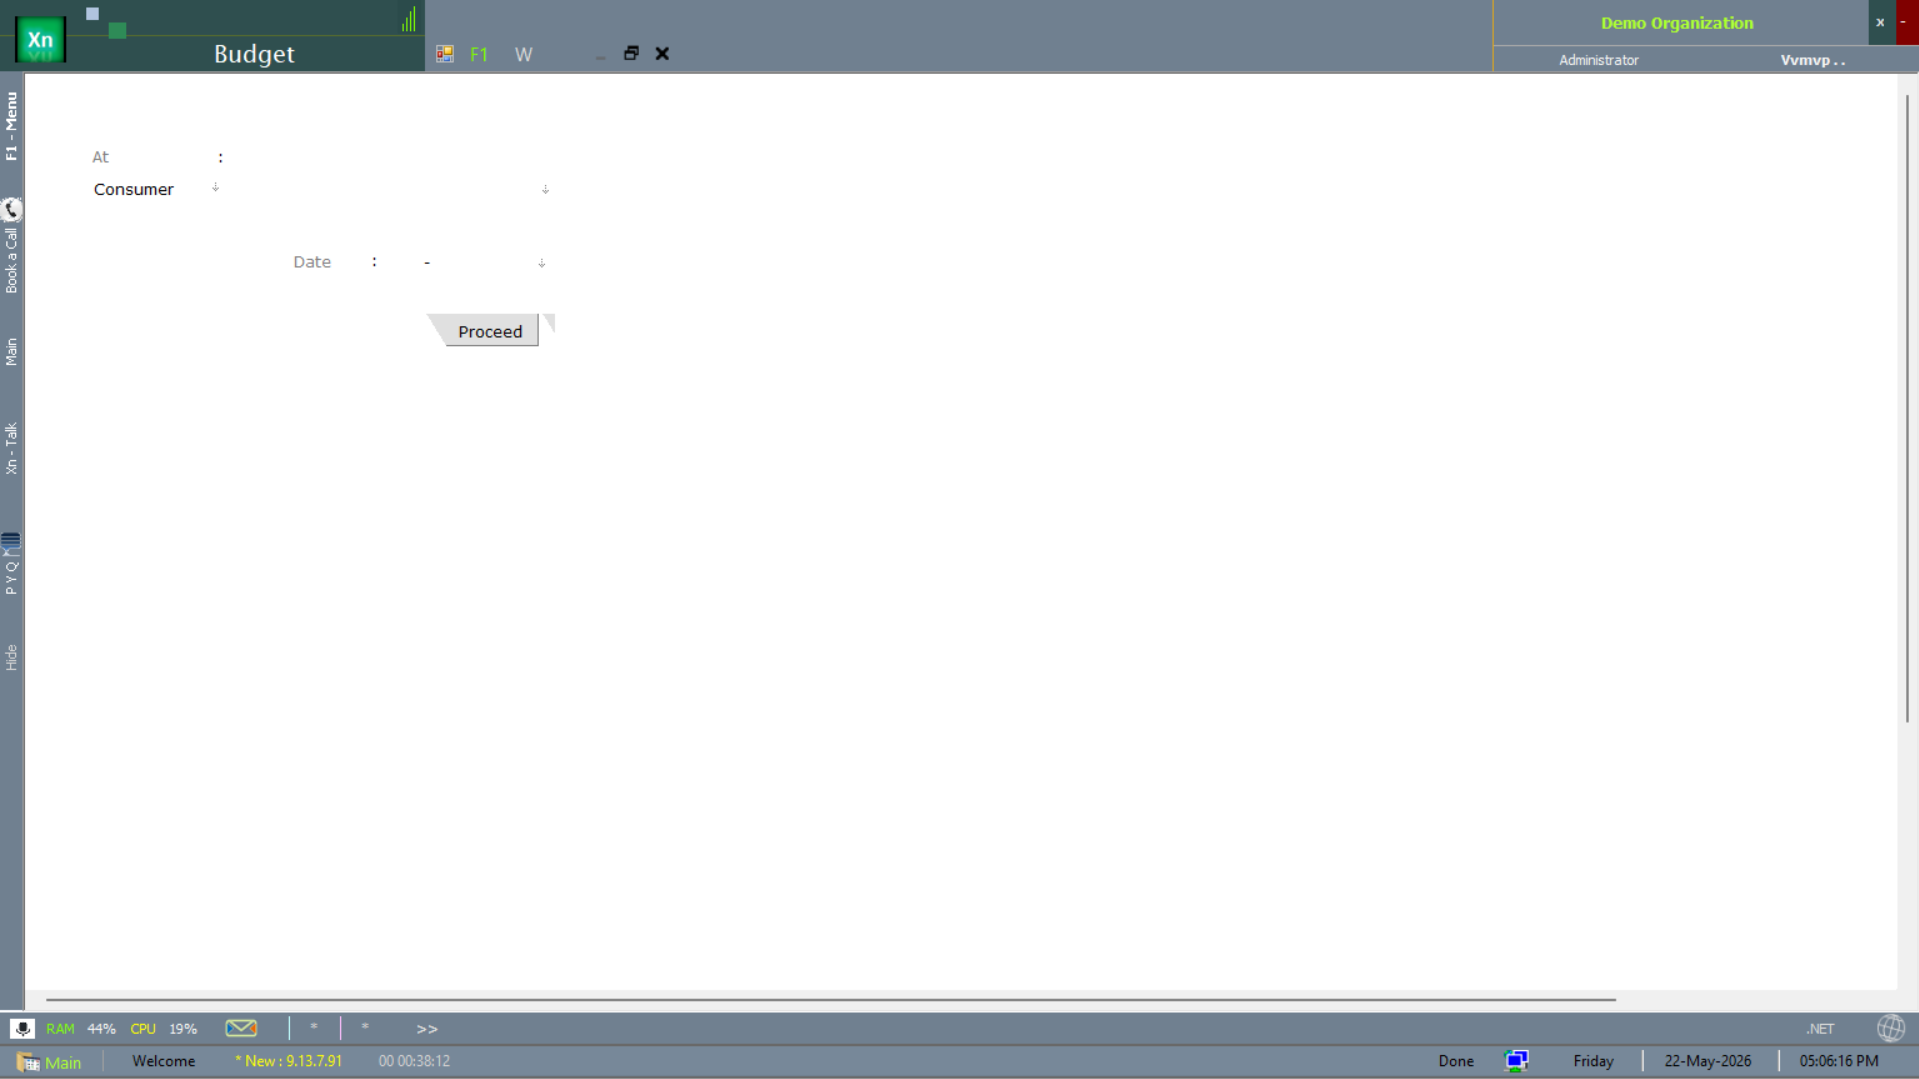
Budget vs Actual
The Budget screen compares budgeted figures against actuals for the chosen consumer (department / category / branch) and period. The variance column drives the review meeting agenda.
Ageing (30 / 60 / 90)
The 30-60-90 ageing analysis buckets outstanding receivables (or payables) into 0–30, 31–60, 61–90, >90 day bands. The right-most band is the collection priority list.

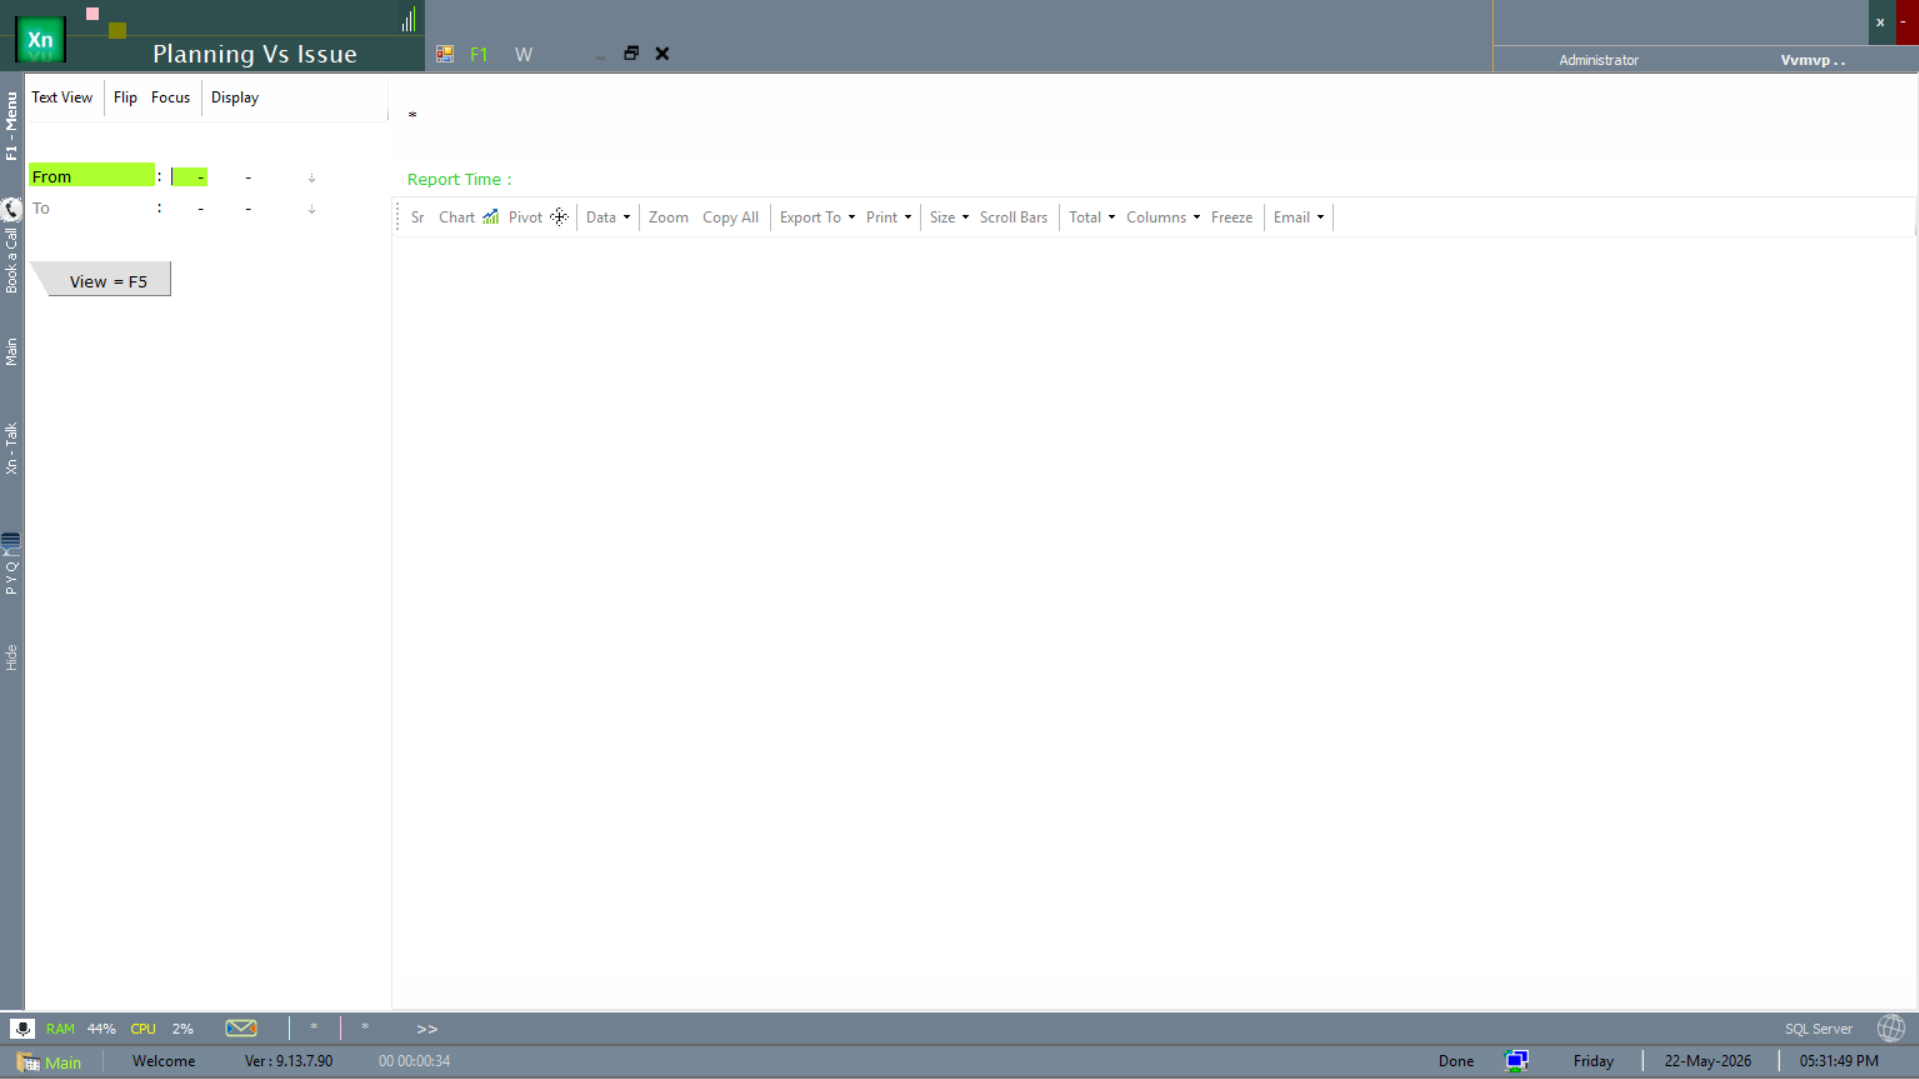
Planning vs Issue
The Planning vs Issue report compares the planned material requirement (from MRP) against the actual issues posted in Statements. The gap signals over- or under-consumption against plan — the planner's health-check.
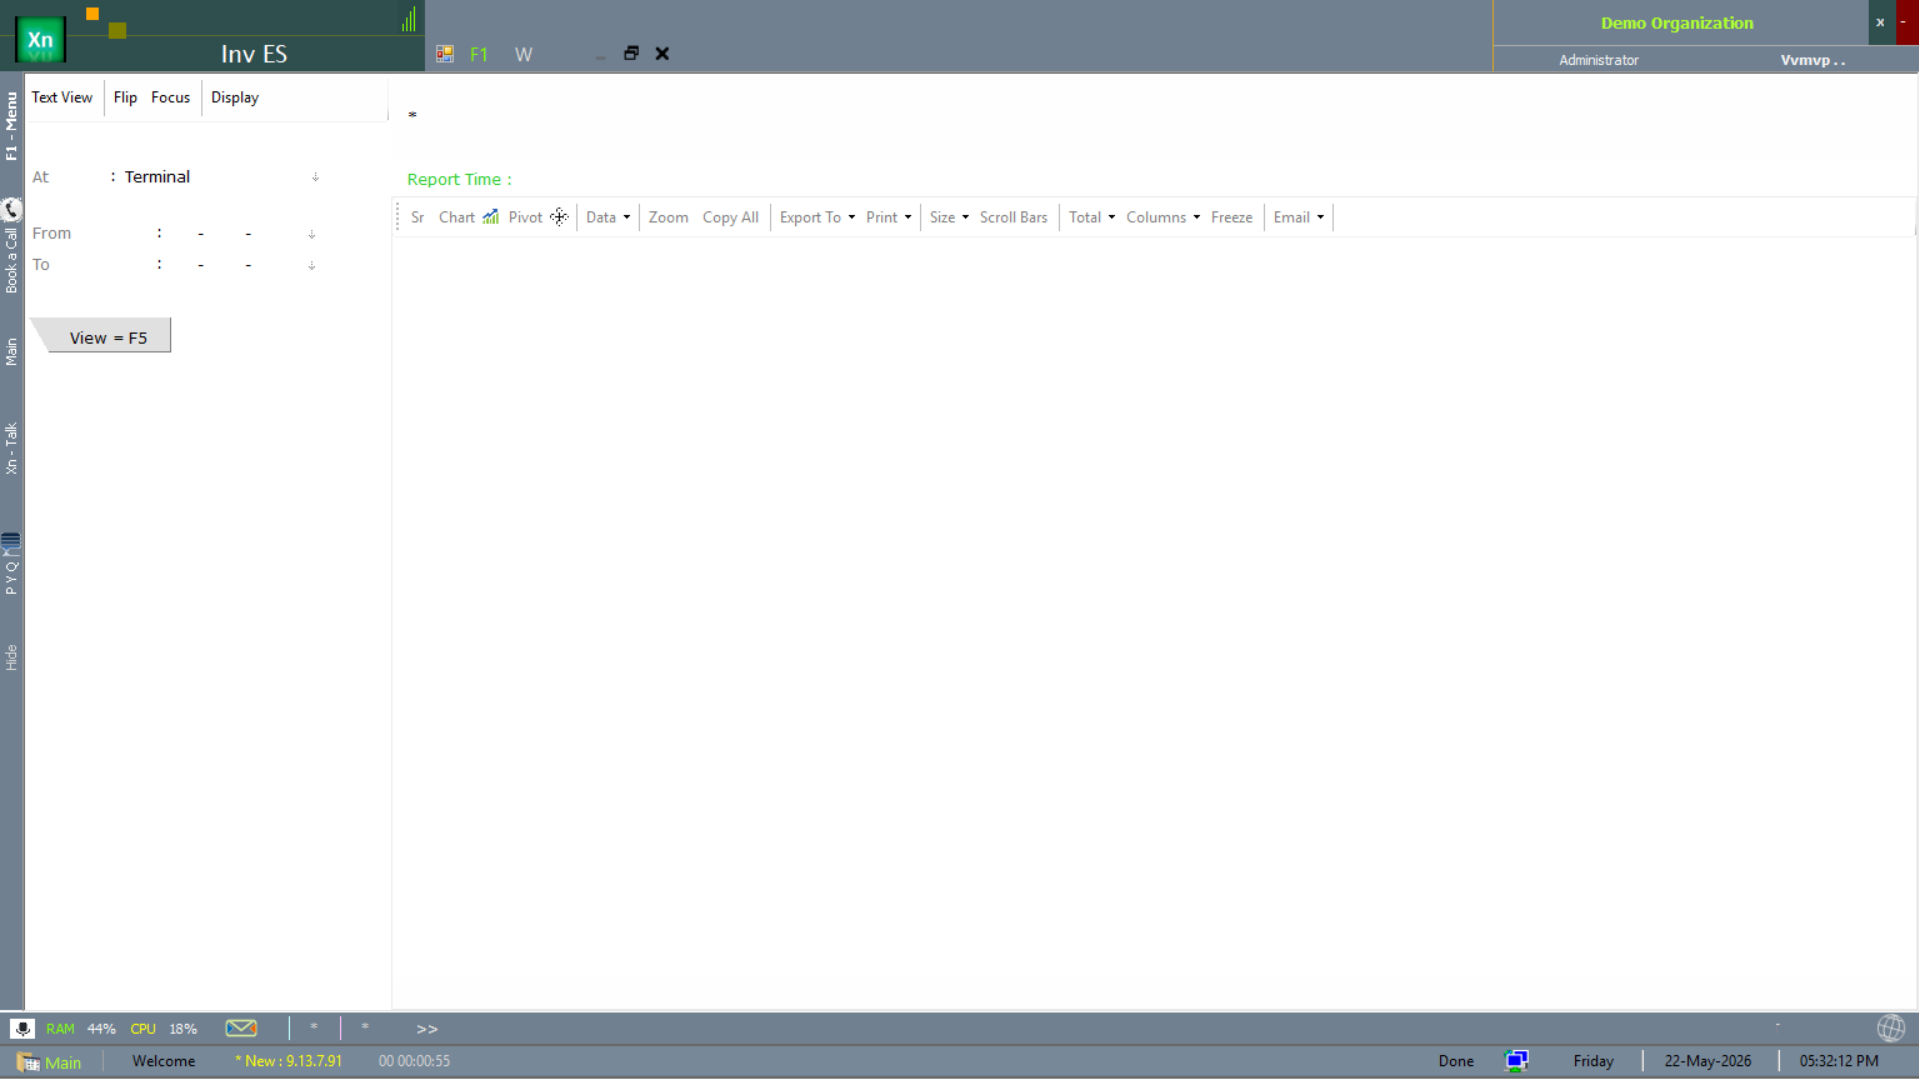
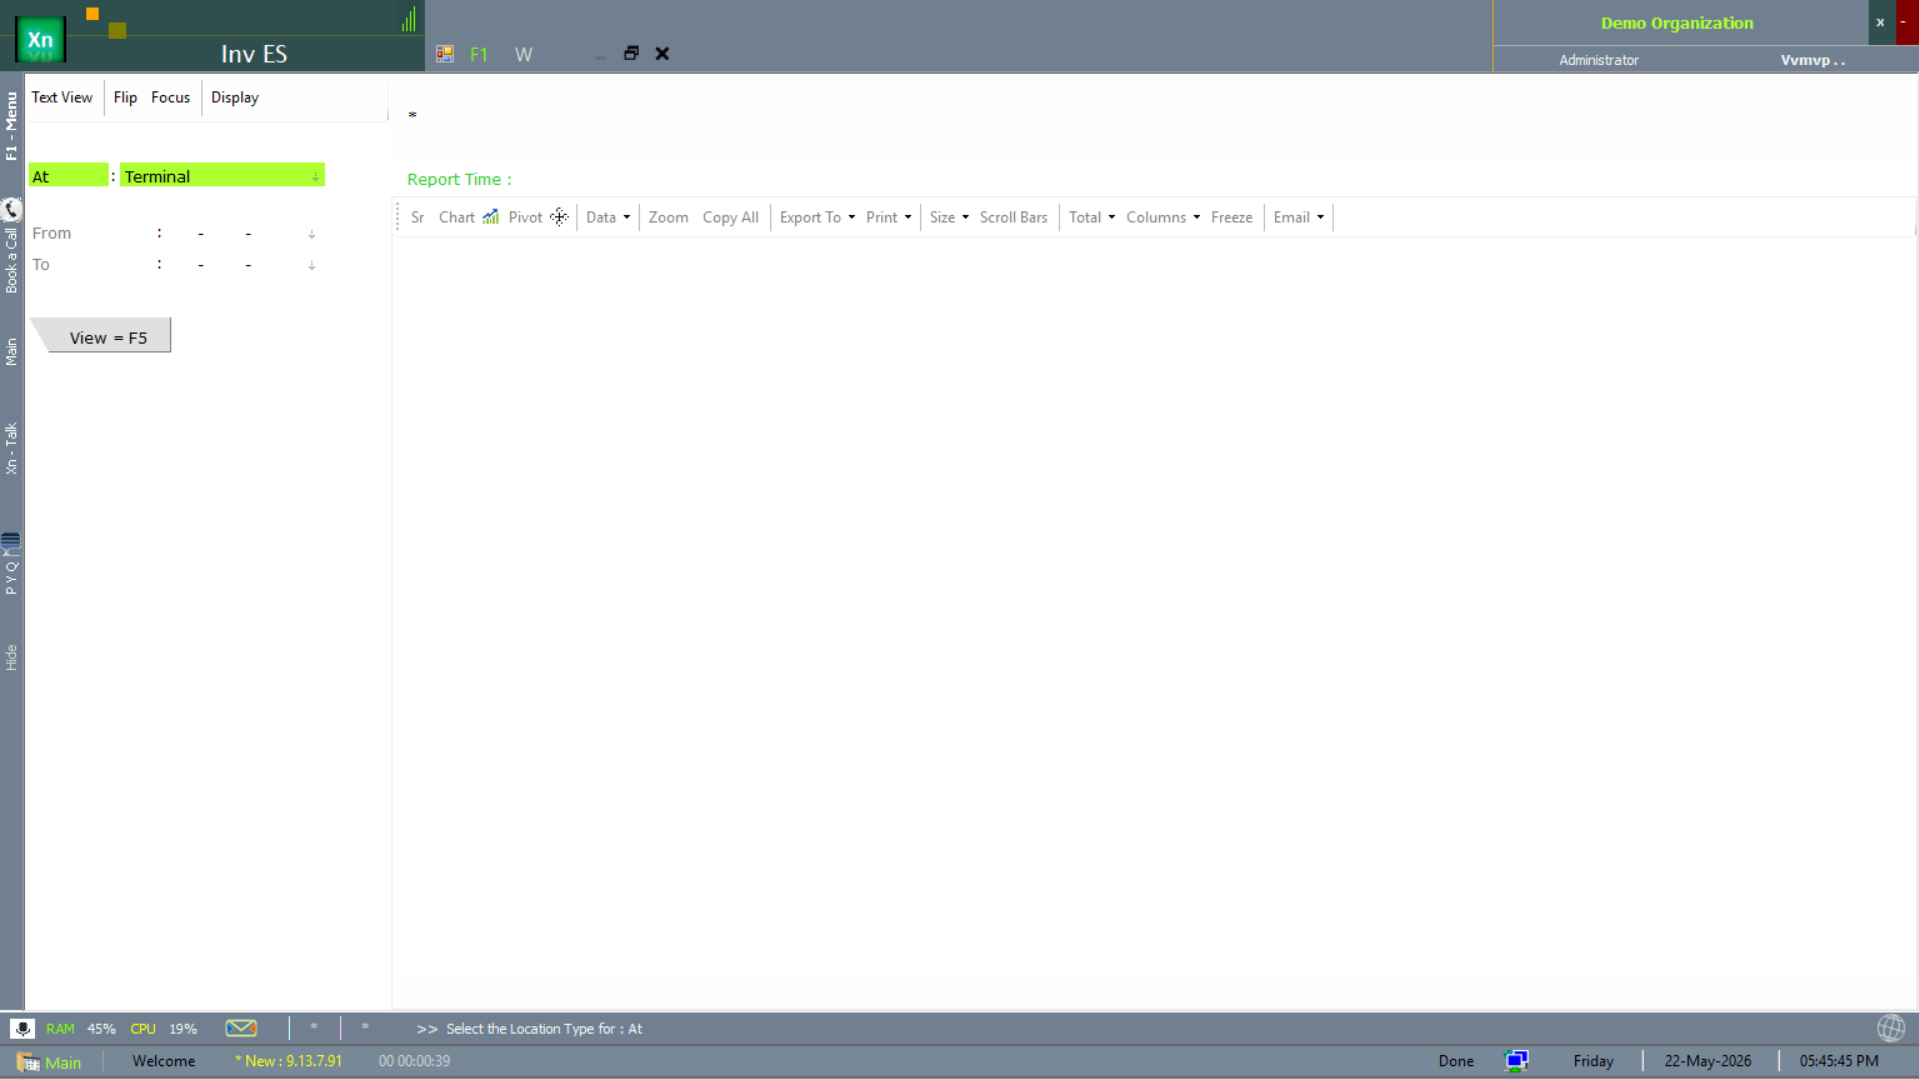
Inventory End-Stock (Inv ES)
The Inv ES report shows closing-stock value by item / category across a period — the end-stock side of the inventory turn metric. Two filter variants ship to match different review cadences.
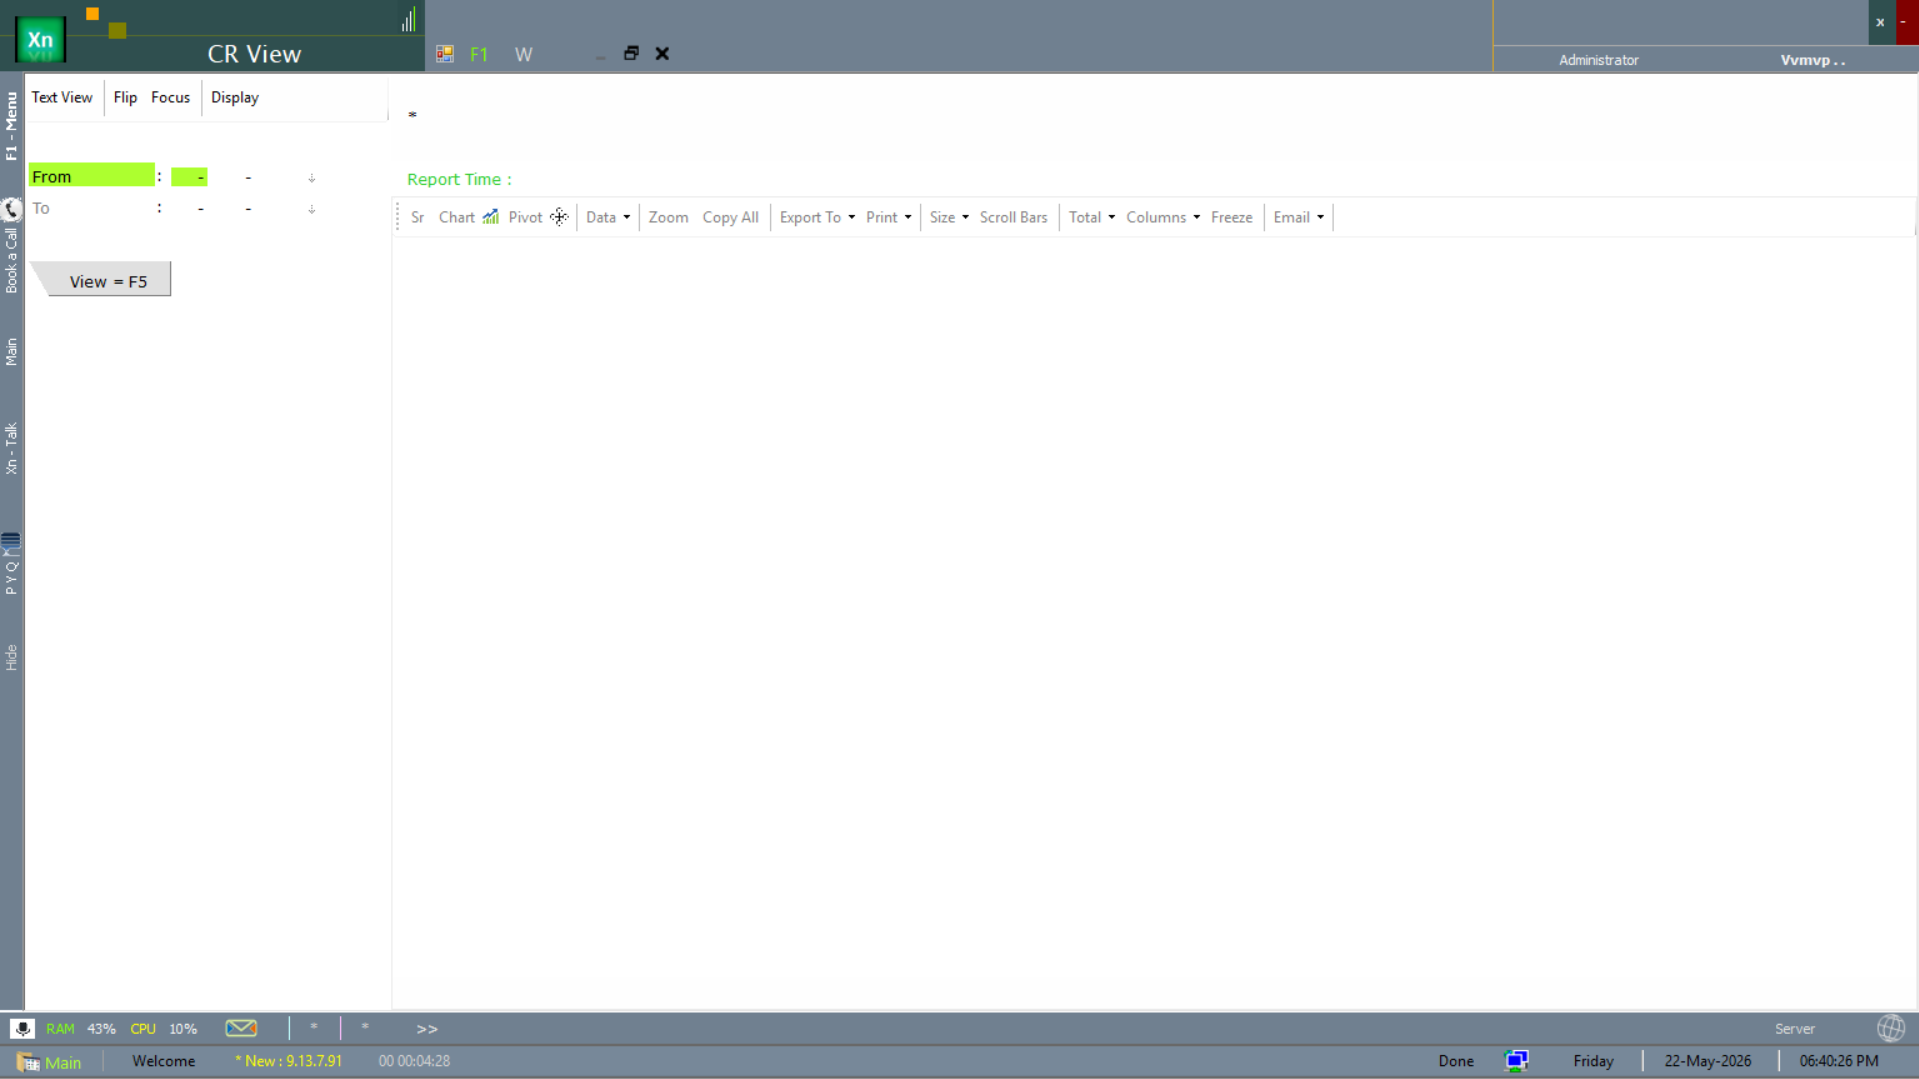
Change Request (CR) View
The CR View lists every change request raised during a period — rate amendments, contract changes, master-data corrections — with the raised-by and approved-by columns for audit. Filtered by date range.
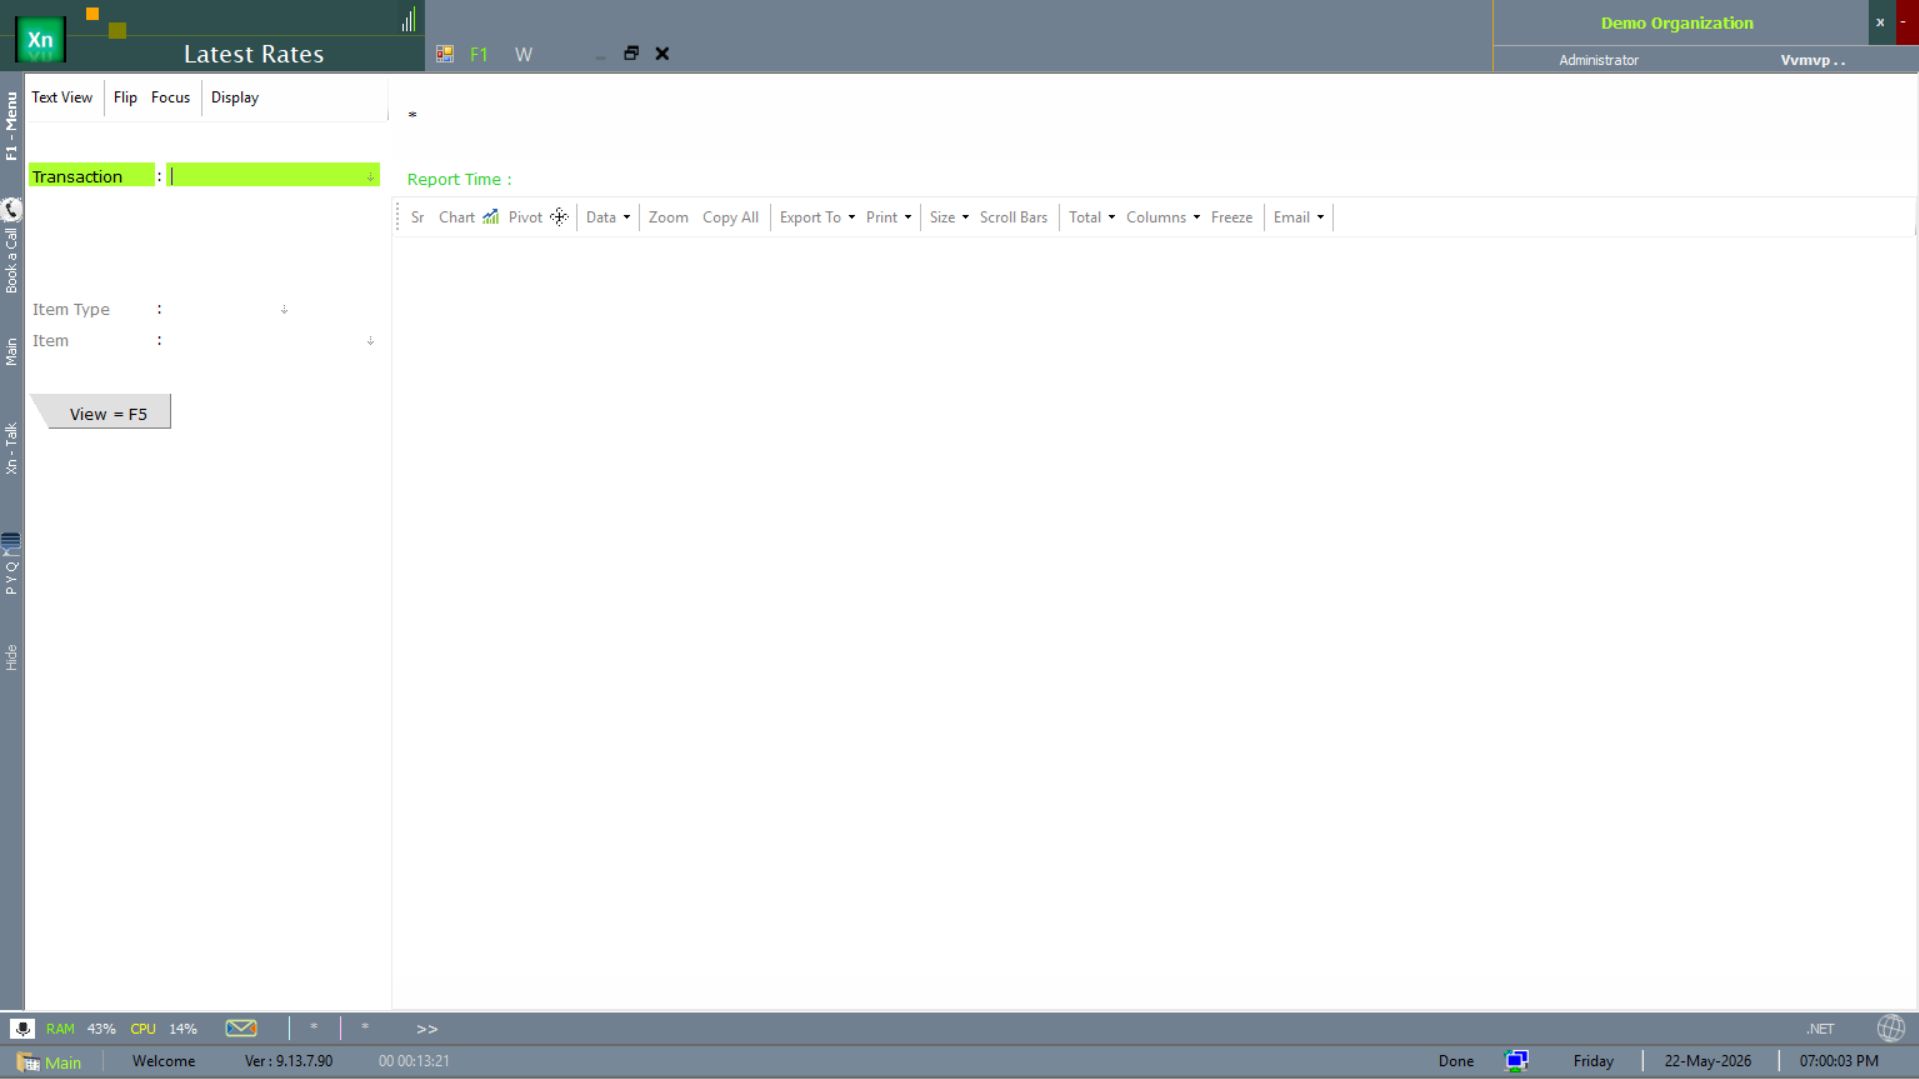
Latest Rates
The Latest Rates screen is the rate look-up: pick the transaction type and item, and the screen returns the most recent rate posted (sale, purchase or rate-master). Used by the front counter to confirm pricing before quoting.